A Professional Approach to Trading Futures

Hello Traders

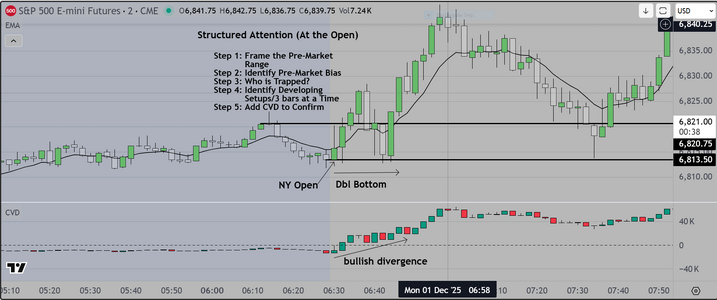
This chart is quite important because it provides the basic rules we follow
in order to profitably trade the open (also known as the "IB" or "Initial Balance")

The skill needed is not native to everyone. In fact most people simply do not know
how to organize themselves, what to focus on, and how to structure their thought
processes so that they can 1) identify tradeable opportunities and just as importantly
2) avoid "traps" and "trading range" opens.

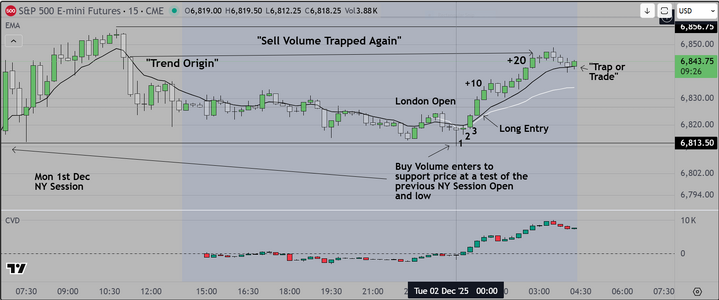
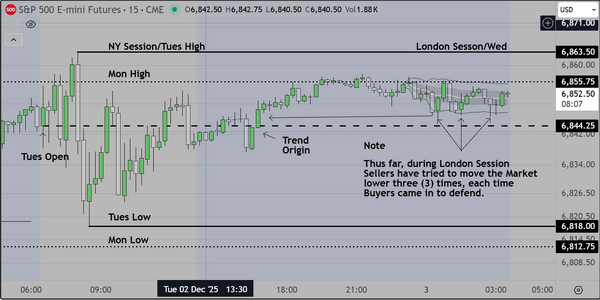
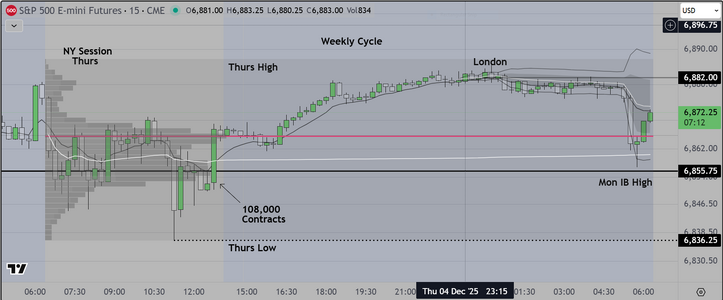
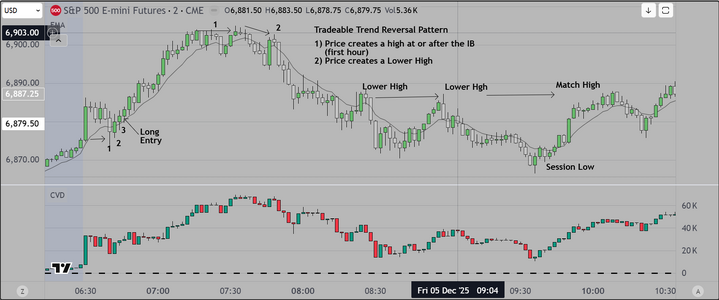
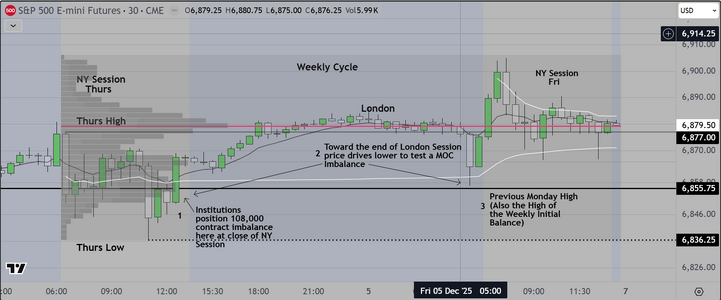
The attached chart shows the previous NY session of the S&P 500 Futures, and we show
a chart with 2 minute candles, because this time frame provides the "granularity" needed
to identify developing, tradeable patterns. The chart is marked up to show "Step1".

In our class, we go over this because this skill (the ability to direct your attention to the most
important data before and after the formal open of any market) is hard to obtain, and unless
the retail trader learns it, IF THEY TRADE THE OPEN, ODDS ARE THEY ARE GOING TO LOSE.
WHY? BECAUSE IT IS DESIGNED THAT WAY. TO CONFUSE, TO TRAP, AND TO STRAND TRADERS
ON THE WRONG SIDE.

Good Luck
 

Attachments

  • Framing the Open.PNG
    Framing the Open.PNG
    117.2 KB · Views: 20
Hello London & Euro traders
It is now approximately 10:20am

Attached below you will find our new Weekly Cycle Markup for the week of
Dec 1st. As seen on this chart, we were in a trending environment previously
and on "Pivot" Wednesday, we transitioned to Trading Range behavior. This
may signal a change (increase) in volatility due to the release of adverse economic
news in the weeks to come. If that is correct, short time frame strategies such as
Mean Reversion and shorter hold times for trades. More to come on this as the next
NY session opens (in about 4 hours)
 

Attachments

  • Weekly Cycle Markup Dec 1st.PNG
    Weekly Cycle Markup Dec 1st.PNG
    157.6 KB · Views: 10
And a chart showing the London Session of the S&P 500 Futures
Open and first trade opportunity.

As seen on that chart, price moved steadily lower during Asia and
when it tested the previous NY session low, buy volume came in
to defend. Once again sellers trapped at that test. From our point
of view this is obvious and may continue for a few more days depending
on pending economic news as follows;

Key economic news for December 2, 2025:
  • OECD Economic Outlook: The Organization for Economic Co-operation and Development (OECD) will publish its latest analysis and projections for the global economy.
  • US Federal Reserve Chair Jerome Powell Testimony & JOLTs Report: Federal Reserve Chair Jerome Powell is scheduled to give testimony, and the Job Openings and Labor Turnover Survey (JOLTs) report is due for release, which will provide insights into the labor market.
  • US Consumer Price Index (CPI): The US will release the CPI for November.
  • Bank of England Meeting: The Bank of England will hold a meeting.
  • European Central Bank (ECB) Meeting: The Eurozone's ECB will hold a meeting.
In our opinion, the "Market Moving" news may originate from the CPI, and Fed Chairman Powell's comments
In our class, we talk about how to time entries based on the market's reaction to news

Good Luck
 

Attachments

  • Dec 2nd London.PNG
    Dec 2nd London.PNG
    120.8 KB · Views: 10
Last edited:
Hello TuscanSun

Thanks for posting
Unfortunately I just saw your post and do not have time to reply in detail
however my recent posts do offer comments relating to direction and bias.
As mentioned so far, it looks (on my charts) as though buyers are in control
and that would mean that the big institutions are interested in propping the
market up for at least a little while longer. Some of this is seasonal "Window Dressing"
and is not sustainable. More to come in future when I start to LiveStream my trading

Good luck
 
Here is an update as regards the trade setup we showed earlier

As can be seen, price continued higher to eventually test what we call a
"Trend Origin". This important feature is also known as a "hold up" price
and is a place where traders (who are in the money") will take profit.
Professionals know this and depending on the context, will take the other side
of that previous long trade hoping to scalp a few points, with the possibility
that it may even reverse. The evaluation process is simple, you "scan left" to
Identify the trend origin bar (usually the 2nd bar from the absolute high or low)
in a larger trend move. At a test of this bar, you evaluate the context as follows

1) Do "in the money" traders have at least 10 or 20 pts profit
2) Do you see volume changing to reflect traders taking the other side of the trade
3) Does the CVD agree

Good luck
 

Attachments

  • Dec 2nd Update.PNG
    Dec 2nd Update.PNG
    129.5 KB · Views: 8
And this update is called "Trap or Trade"
because it shows you how the market can trap you
if you don't have a backtested setup that has an edge

Readers of the previous post will remember that we identified
the "Trend Origin" as a place where traders may elect to take the
other side of the obvious trend, hoping to scalp a few points with
the possibility that the trend might reverse. There is also the possibility
that this might be a "bear trap", where shorts are lured in to enter
and when price tests the 9ema, buyers come back in to "trap" them
as price resumes its original direction. Our backtested setup requires
that price closes above, then below, or there is "no trade". Nothing is
perfect of course, but this works quite well to keep the trader from
being trapped.

Good luck
 

Attachments

  • Trap or traade example.PNG
    Trap or traade example.PNG
    124.3 KB · Views: 12
Hello London & Euro Traders
Here in California it is 7:55pm and in London 3:55am

We attach a weekly update chart markup, that shows the previous week (of Nov 24th)
AND the new week (starting Dec 1st). Traders interested in this approach may want to
refer to previous posts to see those weekly charts

We have added a "note" to the bottom of this chart that "says it all". Read and try to understand
the value this provides. The message is simple. The basis for a trading edge is the realization that
that institutions that control the markets, do so by employing "repetitive behaviors" one of which
is known as "volume trapping". I have marked a few of the places where that can be seen on this
chart. Skilled professionals learn to anticipate these "retests" AND they learn how to trade them.
After that it is all about managing risk and optimizing profit. This is what I was taught and what I
teach to others. If I can learn it so can you.

Good Luck
 

Attachments

  • Dec 1st Weekly Update.PNG
    Dec 1st Weekly Update.PNG
    172.9 KB · Views: 9
Hello TuscanSun

Thanks for posting
Unfortunately I just saw your post and do not have time to reply in detail
however my recent posts do offer comments relating to direction and bias.
As mentioned so far, it looks (on my charts) as though buyers are in control
and that would mean that the big institutions are interested in propping the
market up for at least a little while longer. Some of this is seasonal "Window Dressing"
and is not sustainable. More to come in future when I start to LiveStream my trading

Good luck
Thank you, Steven, for your detailed analysis which I found very helpful and will study your previous post to learn more about direction and bias.
 
Hello London & Euro Traders

Here is a trade setup I could not resist
As with every setup I don't know how it will
play out but I did take a small profit. So I am good
either way.

The markup is pretty simple
 

Attachments

  • Dec 3 London Session.PNG
    Dec 3 London Session.PNG
    73.7 KB · Views: 5
And here is the update just minutes later
after the first half hour of London session

As you can see, price reversed to take me out
(with a small scalp).

This to me is quite valuable in terms of trading education
Suggest interested traders refer back to my previous posts
where I outlined the "repetitive behavior" of previous sessions
as follows

1) Sell volume drives the Market lower, giving the impression that
there could be a trend (continuation), then Buy volume enters to
trap shorts. What a surprise

2) Obvious question is "Why do we take the trade?" and for me
the answer to this rhetorical question is "Why not"? Remember that
our analysis of the behavior is that it STARTS with a move lower.
So that initial move is predictable (statistically that setup has an edge)
The "mistake" (on my part), was to post here instead of taking
the reversal (which if you think about it was also predictable) right?
This of course is the problem with posting, I cannot do both at least not
very well it seems.

That's it for me

Good luck
 

Attachments

  • London Update.PNG
    London Update.PNG
    61.4 KB · Views: 5
Thank you, Steven, for sharing your expertise to explain the real time situation! I have two questions: did you use 23:00 PST(2:00am EST and UTC 7:00am) to place the anchored VWAP and I used the same time 2:00am EST but the lines showed different chart, or it is because we have different settings? It is great to learn from you about real time price action. I am based in Sydney Australia AEDT time zone (UTC +11).
1764757378602.png
 
Yes I did use 2300 hours (my local time). I do that because it provides me with extra
data for this session

I have not had time to look carefully at your chart, but superficially it did look a bit
different than mine.

Attaching a 15 chart below to provide a summary of London Session Price Action
up to the current time. One should probably not be surprised that (once again)
during this session, there were three (3) attempts to move the market lower and
each time, buy volume came in to prevent that.

Look carefully at this chart. It shows the start of the new week and the trading range
behavior that followed. No real earthshaking surprise, same pattern (initial move down
and then buyers appear). Could be traded profitably long or short. Think about it this way
This behavior has been going on for a while now. The sooner you figure it out, the more
opportunity you have to profit.

Good luck
 

Attachments

  • London Update.PNG
    London Update.PNG
    117.9 KB · Views: 4
Need to make one (1) more important point before I fold my tent
for the session

I notice a lot of traders starting to follow this thread. I think its only
natural that some would think that they can make money by simply
buying the pullbacks. I strongly caution folks, do not become complacent
or intellectually lazy. This behavior is going to change, transitioning to
something else and when it does, folks who blindly take trades thinking
they have an "ATM" machine will sustain losses.

Each weekend I prepare carefully by analyzing the previous week's price
action. I always assume that the market can do ANYTHING at anytime.
Be careful. Be responsible for your actions. Think carefully before entering
trades. I always suggest struggling traders begin by trading simulated accounts.
and keeping a journal. Don't trade real money until you have proven you can
manage the risks.

Good luck
 
Back
Top