Hello London & Euro Traders
Currently it is just after 5pm in The City
We woke feeling a bit off, and so did not trade
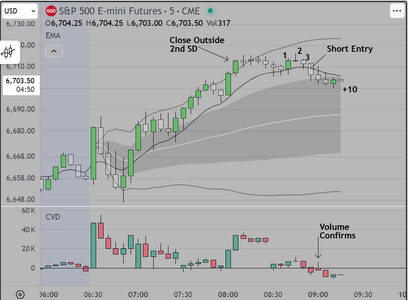
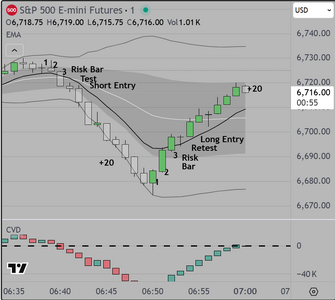
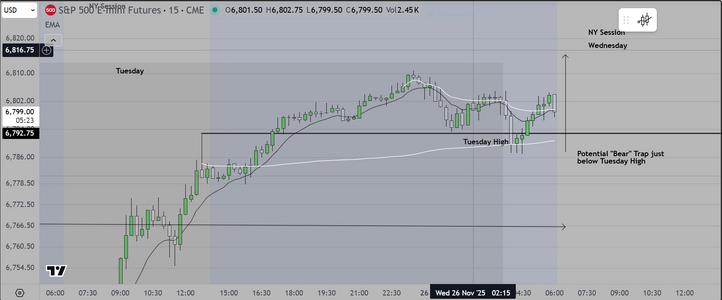
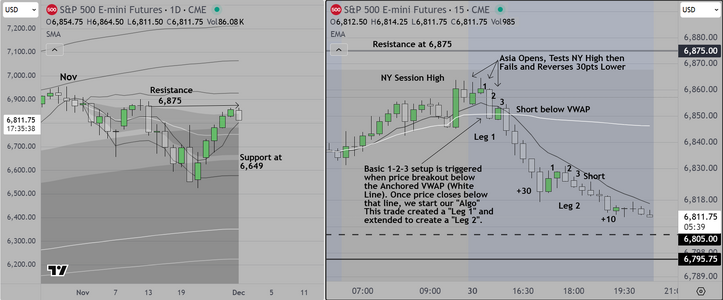
Reviewing the charts we saw several setups, the most recent
is shown on the attached chart and if I had been trading I
would have taken it for the following reasons
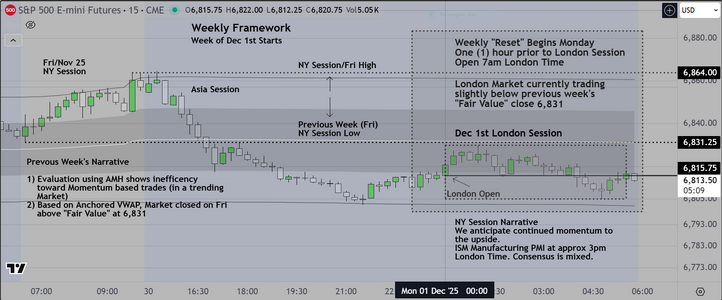
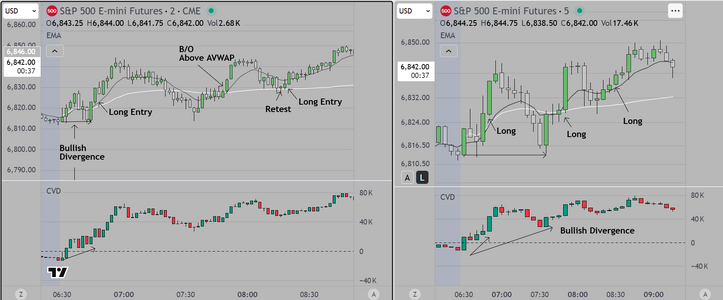
1) The setup occurs after the end of US/Euro Overlap
2) The setup is a reversal which is common at this point in time
3) It is a Mean Reversal Setup, and so we might have taken profit
already (at 8 or perhaps 9 points)
Also the setup was confirmed by CVD (which is in "Test Mode" currently
meaning that it resets hourly.
Here is the chart. The next possible setup would normally occur in about
three (3) hours. We have a doctor's appt and so will not be posting again
today
Good Luck
Currently it is just after 5pm in The City
We woke feeling a bit off, and so did not trade
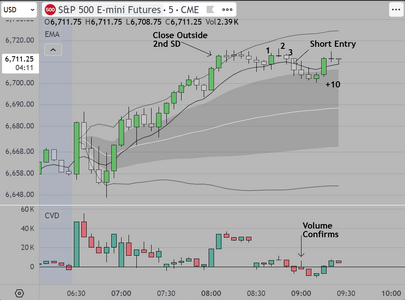
Reviewing the charts we saw several setups, the most recent
is shown on the attached chart and if I had been trading I
would have taken it for the following reasons
1) The setup occurs after the end of US/Euro Overlap
2) The setup is a reversal which is common at this point in time
3) It is a Mean Reversal Setup, and so we might have taken profit
already (at 8 or perhaps 9 points)
Also the setup was confirmed by CVD (which is in "Test Mode" currently
meaning that it resets hourly.
Here is the chart. The next possible setup would normally occur in about
three (3) hours. We have a doctor's appt and so will not be posting again
today
Good Luck