A Professional Approach to Trading Futures

Good Morning

I see that this thread has been left in place. So be it.

I have completed my obligation to train a class and am free to post again
I have also posted on another thread as a courtesy to a trader who indicated an interest
in my work. Copy of that post below

----------------

Good Afternoon

It is Wednesday 29 Oct the time is approximately 1am in the City (one assumes London time)

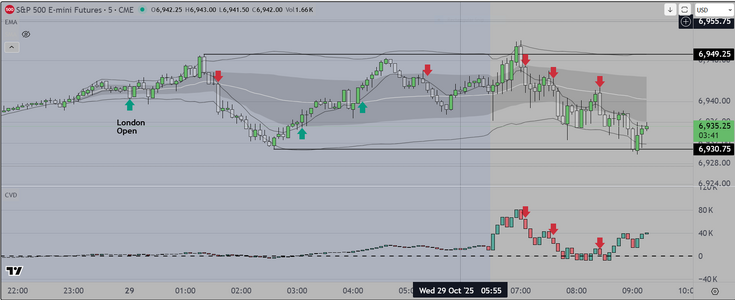
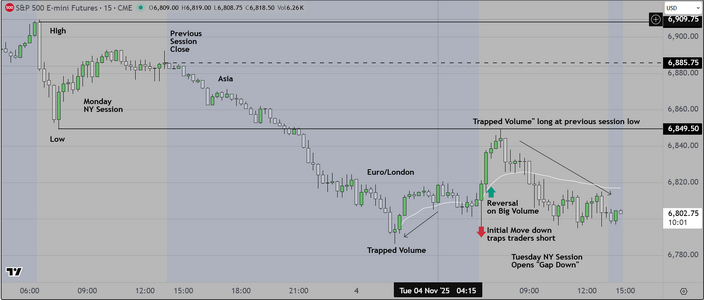
I have begun to provide a comment for traders interested in trading the London Session of the
S&P futures. Current Volatility is approximately 18 after spiking to 24. This event (for most professionals)
signals opportunity and that is what you will see in the attached chart.

I will provide a more detailed comment shortly so that traders interested in this market can evaluate the
opportunities. In my view we are probably going to see more sessions like this one and therefore it might
make sense to think about how to monetize it, providing you have the requisite skills

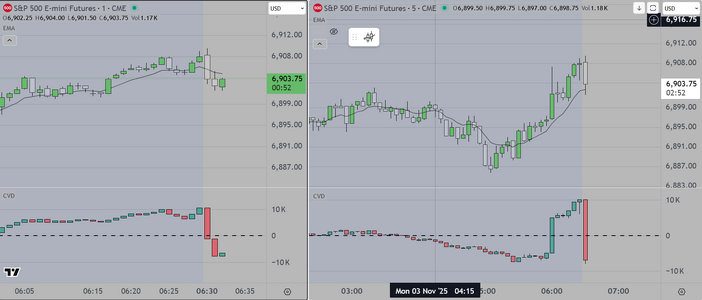
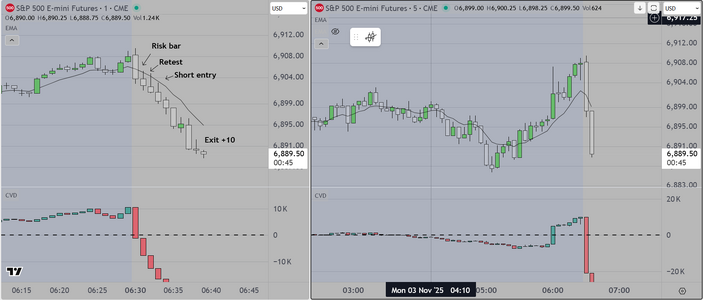
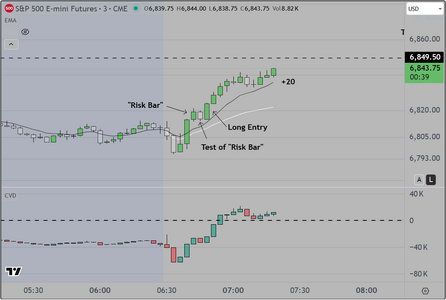
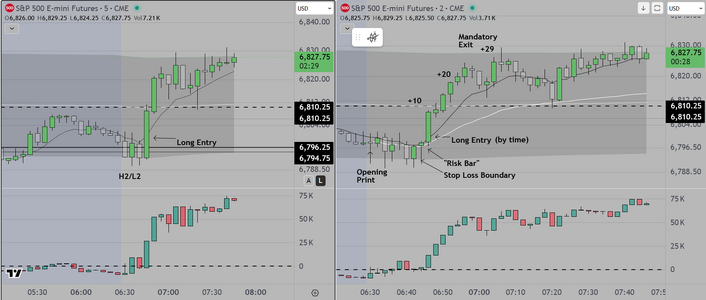
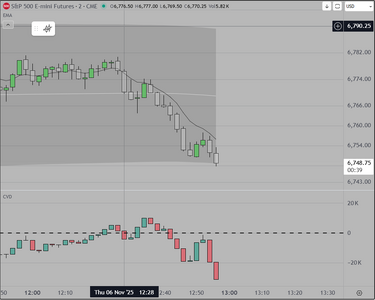
The chart uses 5 min candles and CVD and is about as simple as I can make it for retail traders. As a side not
most professionals would be reading order flow, however I have not see a retail trader do it successfully or
consistently (I am talking about reading "stack & pull"). I am willing to give it a go if someone wants to learn,
I just think this is much easier to learn and the rules are simple.

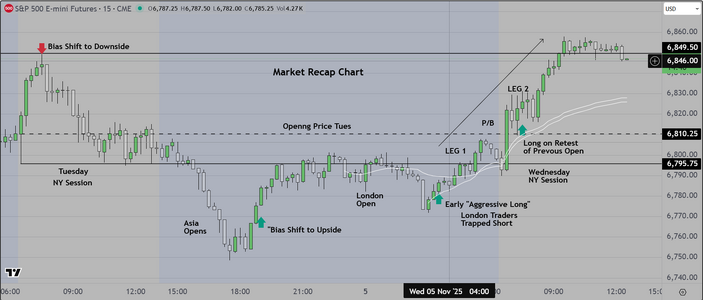
Finally, in a couple of days I will start livestreaming on Twitch. I will show the preparation process that leads to this
result. It requires about 30 minutes prior to the open, and is very simple. We simply review economic data, and create
three (3) scenarios, "Risk On, Risk Off, and Neutral". We also suggest that traders think about restricting their entries
to specific time frames, in order to give themselves the best chance of success.
 
Thanks Trader333, greatly appreciate and I will let you know when I start my
Livestream
--------------

This is a chart that professionals use to provide added context. By anchoring the
VWAP. By anchoring the VWAP to the London Session we can see how that those
institutions view the market. By monitoring and evaluating the Initial balance, we
can then make intelligent decisions as to whether to let wait to see whether the attempted
break to the upside is successful (statistically most fail). As can be seen in the attached chart
this was an easy day, if you knew the odds were in your favor to fade the B/O

During our pre-open preparation we plan for this (even when we are trading alone). It makes
all the difference to have gone over the options and to be ready (on time with entries and exits

Good Luc
 

Attachments

  • London Overlay 29 Oct.PNG
    London Overlay 29 Oct.PNG
    110.9 KB · Views: 14
Here is an example of what is known as the "Power Hour"
which is the last hour of trading the NY session of the S&P500
Futures Market

At this point in time professionals are closing book of business
and staging MOC orders for the "handshake" to the next session
Volatility increases
 

Attachments

  • Power Hour Example.PNG
    Power Hour Example.PNG
    106.6 KB · Views: 10
Posting this example of today's "Power Hour"
final trade. Notice the proximity to the end of session
this is common. Takes some experience to pull it off
but as can be seen, it is worth the effort
 

Attachments

  • Power Hour Trade 29 Oct.PNG
    Power Hour Trade 29 Oct.PNG
    112.8 KB · Views: 11
Interesting example here because it showcases the difference
between professionals and retail traders. Look at the way the volume
dries up in the "Dead Zone". During this time period I (may) be monitoring
however I am not looking seriously for a trade.

As we approach the last hour however you can see volume pick up and they
AT the last hour, we are in the game waiting for volume to show us where to enter
and (just as importantly, where to get flat. Today there were two (2) exits
If you have a way to monitor bar by bar volume it becomes clear

Also notice that traders are exiting at the VWAP (to the tick) AND at the 1st SD band
These are professionals using the tools of the trade to know the right time to exit.
 

Attachments

  • Power Hour Example 2.PNG
    Power Hour Example 2.PNG
    109.4 KB · Views: 12
Good Morning

We are under the weather today with the Flu (according to our physician) and so one of our primary
rules is "no trading when impaired (for any reason, including alcohol, drugs illness, loss of a loved one
I am sure you get it). It never works out well, and we have learned the hard way not to go against this
simple rule

So we will monitor and while doing so, say (to ourselves) "If I were trading, where would I enter and exit?"
Attaching one chart to show the basic opening range setup that I have developed for retail traders. The
goal of this setup, which I call a "White Glove System" is to take a quick 10 pts and then get out clean
The larger goal is to do this a minimum of 3 days per trading week. In tests it works really well
 

Attachments

  • White Glove System 1.PNG
    White Glove System 1.PNG
    96.9 KB · Views: 5
And here is the result. I am tempted to say "as luck would have it" but I have put in the work to test
this extensively, and this is what I would expect

The system is based on the concept of identifying what professionals call a "Risk Bar". The next bar
must test this bar, and IF it acts properly, it tells you where to enter long or short. At the open when
volatility is high, this often delivers a quick +10. When the market ranges, the behavior at the "Risk Bar"
warns you and keeps you from getting chopped up

As I have mentioned to Trader333 and to Tomorton, I will be LiveStreaming it on Twitch soon enough
and now I am going to get some rest

Good luck
 

Attachments

  • White Glove System 2.PNG
    White Glove System 2.PNG
    104.4 KB · Views: 5
It is 7:45am on Monday (obviously) and before I retire to rest up
I wanted to show one of the "aggregated data points" used to
create my system. It is whether the market gaps (up or down) and
on what day of week. If I were to ask you what the statistics say
about how often gaps fill based on day of week data, would you know
the answer? Today was one of those days.

Finally, aggregating data is one of the skills that professionals bring to bear
when making trading decisions. We look at a variety of data, and these data
points are weighted based on past performance. Coming into the day, we
saw price spike in the pre-market based on 1) earnings, 2) AI optimism
3) US/China trade détente, and 4) the possibility of profit taking on the open
The last and most heavily weighted data is condensed into three bars
If the planets align we take the trade, if not we watch. and the worst that can
happen is we lose a couple of %, or we miss an early trade. Our strategy provides
three possible entries based on time.

Good Luck
 

Attachments

  • Gap Fill  by Day of Week.PNG
    Gap Fill by Day of Week.PNG
    88.7 KB · Views: 5
Last edited:
Hello
As mentioned previously I am laying low to recover from the Flu
Getting up a while ago I saw this setup during the "Power Hour"
I am having coffee and marking up my chart so that (Retail) traders
can see what professionals are looking for in this last important time
period
If you have the ability to monitor volume of contracts, you may notice that
one of the last bars had more than 57,000 contracts, much more than the bar
on either side. This is typical, and provides context for the next session as institutions
close out their book of business, and/or proceed with handshake to the next team
Asia/London. I go over the logic with clients, so that they can decide whether to hold
positions overnight or cash out

These trades are known by professionals as "layups" because risk is minimal and a skilled
trader can often make as much here at the end of the session, as they did at the beginning.
Refer to the three (3) previous posts and you will see the same setup at the open

Good Luck
 

Attachments

  • Power Hour Example 3.PNG
    Power Hour Example 3.PNG
    112.3 KB · Views: 8
Last edited:
A final comment as regards today's NY session

This has (for me) become quite simple. The edge I have is stable
meaning that there are no "temporal" holes in the setup. It works day to day
week to week, and so forth, about the same. So if you can learn to recognize
the presence of the "Risk Bar" there is hope for you to succeed. There is more
however, that a trader has to learn to make it work (management skills, emotional control)
A successful trader has to learn 1) to recognize the setup, 2) to accept that nothing works
all the time (he or she will have periodic losses), 3) They have to discipline themselves to
take the entries (all of them), then to follow the rules, including when to exit for a profit
and even more importantly, when to exit and take a loss. They (generally) will learn the importance
of journaling and analyzing results, AND how important it is to understand that how they act
(with discipline or not) is what often determines whether they will be successful in creating
a viable business model. My mentor used to say that you learn much more from your failures
than you do from your success.

Good luck
 
Good Day London & Euro Traders

Posting another easy trade taken during the IB of the S&P500 Futures

As can be seen, I follow the simple protocol as follows

1) Identify the "Risk Bar" (usually the third bar in a sequence)
2) Wait for a test of the "Risk Bar". This test informs the trader as to trade direction
and strength of the move. Skilled traders will also look for one (1) additional data point that aligns or
confirms the trade
3) Take the entry and manage based on context. We are generally looking for +10 and in some cases
+20 if our measure of volatility is high as it is today.
4) Exit "clean" and wait for the next time period (for us, it is likely the "Power Hour" (see prior posts)

As mentioned previously we execute this process two or three times per session

Good luck
 

Attachments

  • Risk Bar Test & Entry Exmple.PNG
    Risk Bar Test & Entry Exmple.PNG
    57.4 KB · Views: 5
For Retail Traders who are struggling, take note

Of all the things that one could learn, this without a doubt is the most
important, and yet, I will bet that none of you, use this format. Professionals
use it everyday, because it allows us to plan possible scenarios

Specifically, using this simple chart, with 15 min candles, showing just two sessions
a trader can develop an accurate and effective plan that will direct his (or her) action
based on tests of "Key References" like the previous sessions high or low

I never fail to fill our this chart BEFORE the current session opens. It shows me where (at what
price) other traders are likely to be trapped long or short. It also shows me whether price has
a chance to fill a gap open, and using this chart, I am able not only to make good decisions as
to which direction to favor, but HOW LONG TO HOLD, AND WHEN TO GET OUT. (Tomorton this is
what you were talking about in your post). This is how you figure it out. Otherwise you are lost

If someone has an interest I will add detail othewise

Good luck
 

Attachments

  • Market Outline.PNG
    Market Outline.PNG
    102.6 KB · Views: 5
Last edited:
Good Afternoon London & Euro Traders

This is a screen shot for Paul

This is one of two main screens that my students (will) use
As you can see there are two (2) time frames (5min & 2 min candles)
From this vantage point, I will execute trades and students have the
option to follow (copy at their own risk) or simply observe

My ultimate goal is to show struggling traders that there is way
to make money in this very competitive profession, if they will learn
basic risk management skills as well as how to organize each intraday
session into "windows of opportunity".

My trading day is already over, and I am usually able to do this three (3)
out of five (5) days of the week. For the other days, my goal is to 1) recognize
when the price action doesn't fit my system, then 2) proceed with caution
and limit exposure to risk (or simply do not trade).

I know that this works, and am excited to show others the possibilities

Good luck
 

Attachments

  • White Glove Retail System.PNG
    White Glove Retail System.PNG
    127.1 KB · Views: 4
Here is a "Market Recap" chart showing the price path from Previous (Tues) NY Session
through the current (Wed) NY Session

This chart provides a skilled user with a solution to the problem "how to have confidence in your entries and exits"
Initially we provide the logic (this is a "White Glove" system) and along the way we show the struggling trader how
to "fill in the gaps" in their knowledge. As they see it done repeatedly, they start to anticipate the right moves AND
with that comes confidence, the ability to handle the periodic challenges and "light at the end of the
tunnel".

As with my previous charts (and from this point forward) if people want more detail, they will have to engage and ask
(and I will be glad to provide it)
 

Attachments

  • Market Recap 11-5-2025.PNG
    Market Recap 11-5-2025.PNG
    112.6 KB · Views: 1
Back
Top