User
Experienced member
- Messages
- 1,170
- Likes
- 23
I thought I start a new thread for interesting UK shares that have potential to move higher or lower in relation to its chart set-up.
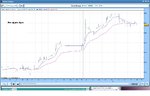
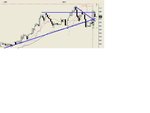
I have started the thread with two buys: Burren Energy and Cairn Energy. You don't need to follow the picks but you can simply make up your own mind by looking at the charts posted.
Hopefully the thread will help newbies who are just starting up with their trading in terms of technical trading.
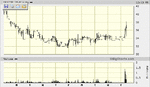
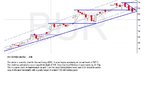
I'll post a few others when and if I see good opportunities develop.
I am confident in the two initial charts posted.
Good Luck
I have started the thread with two buys: Burren Energy and Cairn Energy. You don't need to follow the picks but you can simply make up your own mind by looking at the charts posted.
Hopefully the thread will help newbies who are just starting up with their trading in terms of technical trading.
I'll post a few others when and if I see good opportunities develop.
I am confident in the two initial charts posted.
Good Luck
Attachments

Last edited: