The Disaggregated COT Report
The first Commitments of Traders ("COT") report was published back in 1962 and antecedents of the report can be traced all the way back to 1924. Since its inception, the COT report has gone through numerous changes and improvements over the years. The Commodity Futures Trading Commission ("CFTC"), an independent US agency created by congress in 1974 to regulate the US commodity futures and options markets, is responsible for maintaining the COT report and publishes the data on its website (www.cftc.gov). The CFTC also provides several decades of historical COT data on their website.
The COT report provides a breakdown of the buying and selling that takes place in the futures markets each week. By combining certain price indicators with specific information contained in the COT report, one can create very powerful trading tools. For example, one can ascertain that certain large market participants likely have access to certain fundamental information before the information is made public. Thus, one might monitor the trading activities of these large participants to gain insight into the direction of the market. The COT data provides information that makes this possible. The insight obtained by combining COT data with price indicators can be far more reliable than any price indicator by itself (see Box on Trading Strategies).
Over the years the data in the COT report has become highly regarded and highly sought after as a trading tool used by traders and speculators all over the world. The CFTC has made numerous improvements and updates to the report over the years. Below is a list of the most significant updates and improvements since the 1990s.
- 1990 - CFTC increased the frequency of the report from monthly to mid-month and month-end.
- 1992 - CFTC increased the frequency of the report to every two weeks.
- 1995 - CFTC added options data to the COT report (creating combined futures & options rpt).
- 1995 - CFTC began providing the COT report on their website free of charge.
- 2000 - CFTC increased the frequency of the report from every two weeks to weekly.
- 2007 - supplemental report was released to track "Commodity Index Traders".
This special report covers select agricultural markets only.
- 2009 - significant COT changes occurred. In September 2009 the CFTC began publishing a new disaggregated COT report.
The new disaggregated COT contains new categories of traders and begins classifying traders differently. No longer are traders classified as simply commercial or non-commercial. The new report contains more specific categories, such as "Producer/Merchant/Processor/User", "swap dealers", "managed money" and "other reportable" as well as a non-reportable category.
The changes made during the 2nd half of 2009 are the most significant improvements ever made to the report in my opinion. These changes were made in response to significant changes in market dynamics. ETF's have become extremely popular during the last 10 years, and ten years prior to that they simply did not exist. In addition, OTC activity in derivates has exploded. Swaps are a big part of this and the recent changes in the COT report now include a category for tracking swap dealers. Furthermore, during the last 10 years we have seen pension and endowment funds moving into commodities, which did not occur to any significant degree during the prior ten years. Pension and endowment funds now control huge sums of money, much of which is passively managed index fund exposure. Some would say this is only the tip of the iceberg. There is a great deal more in sovereign funds for example.
The driving factor behind the flow of money into commodities may simply be out of control printing of fiat currencies throughout the world. Whatever the case may be, the upgraded COT report should prove very useful in the years ahead. The new swaps category will help track pension fund activity. The fact that the CFTC has pulled the swaps out of the traditional commercial category also enables followers of the COT report to track the activity of true hedgers in the same way that we have tracked them in the past. I have highlighted the recent changes in the COT report below.
The original COT report contained the following categories of traders:
1 Commercial category
2 Non-Commercial category
3 Non-Reportable category
The new disaggregated COT Report contains the following categories of traders:
1 Producer/Merchant/Processor/User category
2 Swap Dealers category
3 Managed Money category
4 Other Reportables category
5 Non-Reportable (small positions under the CFTC position limits)
Each category of traders in the COT report provides a unique view on the market. The new Producer/Merchant/Processor/User category consists primarily of commercial hedgers. This is what the "Commercial" category originally represented in the traditional COT report. In recent years the growing number of swap dealer positions greatly skewed the data in this category. The new disaggregated COT report addresses this issue by separating the swap dealers out of this category and placing these positions in their own category. Thus, the Producer/Merchant/Processor/User category now represents traditional commercial hedgers only, as did the original commercial category. This group is widely considered to be the most knowledgeable in a market. For example consider the grain markets. A large producer of wheat typically understands the supply and demand fundamentals much better than a small speculator, for the simple reason that they are much closer to the market and that they create the supply. A large commercial consumer (such as General Mills for example) likewise typically understands the supply and demand much better than the individual speculator. Speculators on the other hand tend to understand the technical condition of the markets better than the commercial hedgers. And the larger the speculator the more knowledgeable they tend to be in regards to the technical conditions. Large speculators focus on price behavior and on deciphering fundamental information. Commercial hedgers on the other hand are the suppliers of the fundamental information and they tend to know or care very little about the technical condition of the market. A commercial producer in copper for example will use the futures contracts as a way to lock in the price they receive for the copper they mine out of the ground. They may increase their hedging activity when they believe there is a risk that prices may fall in the future. A commercial consumer on the other hand is much more concerned with the risk of rising prices in the future. As such, each commercial entity has opposing needs. The COT report allows us to monitor the hedging activities of these entities, and by doing so we hope to gain insight into their view on the direction of the market.
The "managed money" and "other reportable" categories combined equate to the traditional non-commercial ("large speculator") category in the original COT report. The big change here is the move away from "commercial" and "non-commercial". The fact that the CFTC is taking this approach indicates we may see more categories or expanded categories in the future. No longer are they locked into lumping traders into "commercial' and "non-commercial" categories for example. The Managed Money category is self-explanatory. The Other Reportables category comprises other large trader positions (above the CFTC reporting limits) that do not fall under the "managed money" category. Exactly who falls under this category is ultimately up to the CFTC.
With regards to the future of the original COT report. My understanding is that the CFTC intends to continue providing the original COT report, in its original format, along side the new disaggregated report for the foreseeable future.
Example - Copper
Let us compare the data using Copper as an example. Figure 1 (below) plots the Copper net-commercial position from the original COT report, where the net-commercial position includes the swap dealer positions.
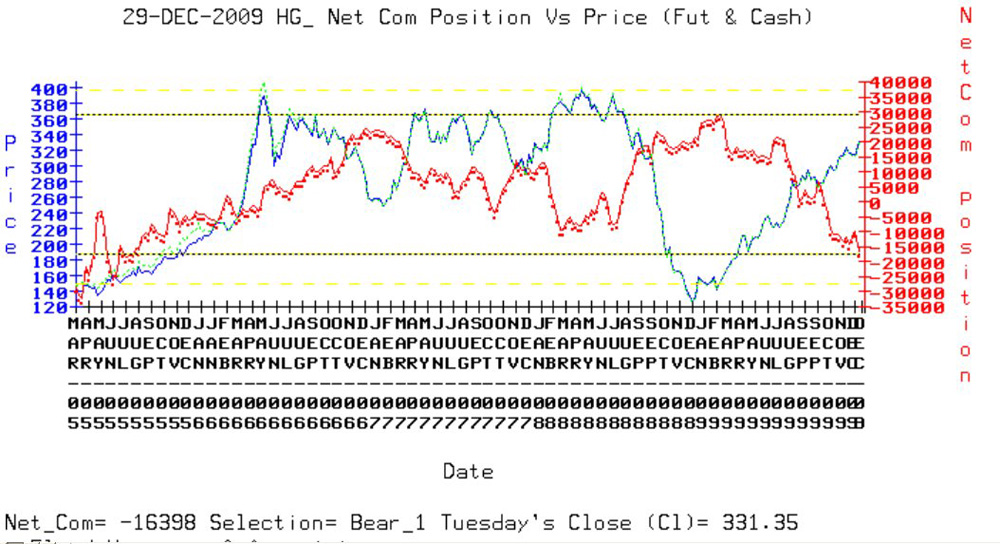
Figure 2 (below) plots the net-commercial positions in Copper from the new disaggregated COT report for the same period, with the swap dealer positions excluded.
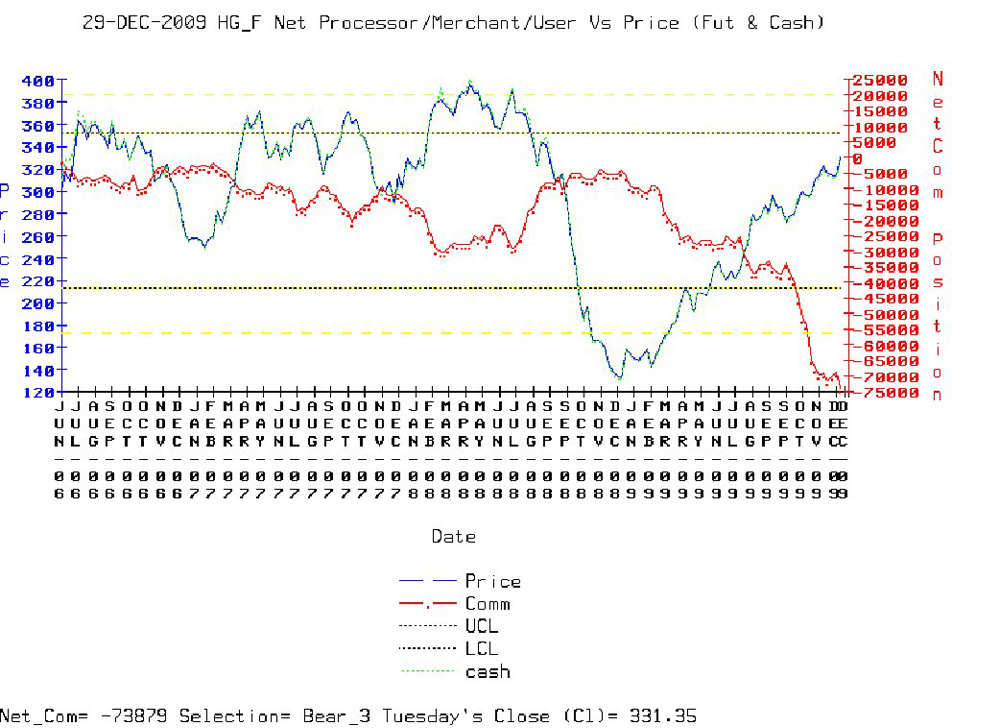
I would like to draw your attention to two observations: i) How much deeper the net-commercial position is in the disaggregated COT report than in the original report and ii) How the near-inverse relationship between price and net-commercial positions is more consistent throughout the period in the disaggregated COT report. That said, we don't have enough data yet to draw a reliable conclusion on this second point. Notice the disaggregated data only goes back to June 2006. This is all the disaggregated data the CFTC has given us (only back to June 2006, whereas the CFTC provides traditional COT data back to 1986). Notice also if you compare the traditional net-commercial to the disaggregated net-commercial back to June 2006, the inverse correlation is very similar. Therefore, I would really like to have more disaggregated COT data to compare with the traditional report. As time goes on, we will accumulate more disaggregated data, and then we can make more meaningful comparisons).
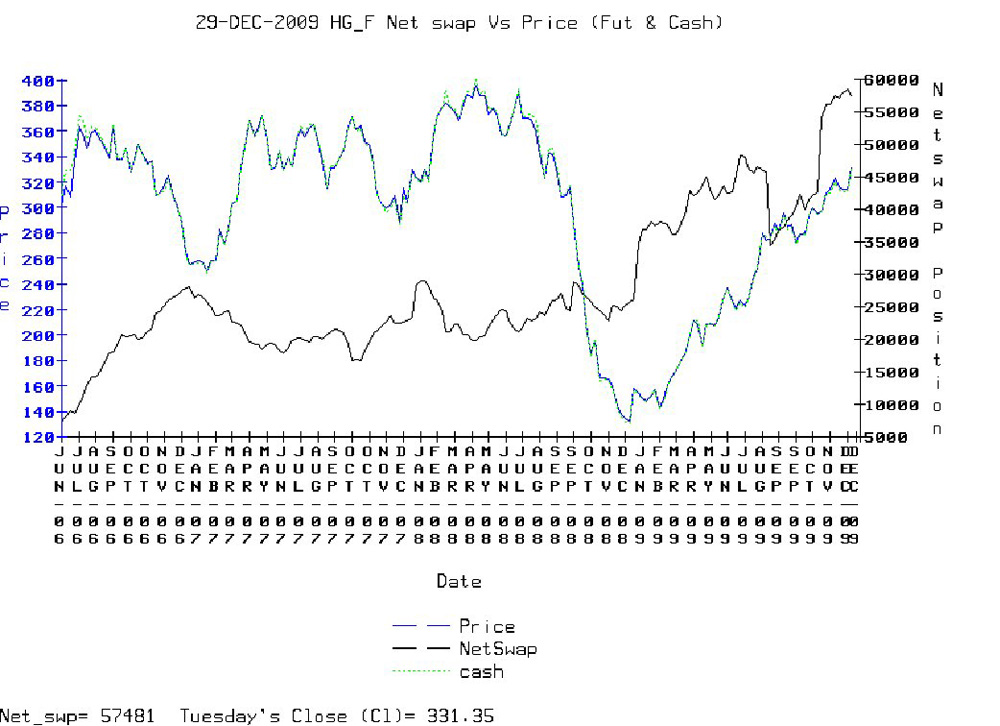
In the original report, the traditional net-commercial position in copper (as reported on 12-29-2009) is -16398. The negative number indicates the number of commercial short positions is larger than the number of commercial long positions. This number is even more negative when the swap positions are moved. The net-swap position for copper on 12-29-2009 is +57481 (Figure 3 below). Subtracting this position from the traditional net-commercial position equates to the new disaggregated net-commercial position for 12-29-2009 of -73879.
So what are the swap dealer positions and how might these positions impact the markets? Swap dealers provide a service to pension funds and other larger market participants (such as endowments for examples). When a pension fund decides to allocate a portion of their total portfolio into commodities, they generally do not enter directly into the futures or the spot markets. Instead they tend to allocate funds into commodity indices. One such popular index is the Goldman Sachs commodity index for example. This index generally consists of 24 different commodity markets. The number of markets in the index can vary slightly based on weighting (energy markets). A pension that allocates a portion of their assets into the commodities may do so using this index. The index itself however is not used. Instead, positions must be established in each individual market that makes up the index. Obviously this involves a good bit of work. The individual positions must be managed through rolling and so forth. The pension fund generally does not manage the positions and neither do the swap dealers. A swap dealer will simply provide the means for which the pension fund can swap a portion of their assets from one investment into another. In this case, a swap dealer may accept a known rate of return on a basket of dividend paying stocks in exchange for providing the pension fund with an unknown rate of return on a basket of commodity markets (e.g. Goldman Sachs commodity index). The value of the two assets may be equal at the time of the swap. The rate of return that the swap dealer receives is known while the rate of return the pension fund will receive is not known. This is the risk/potential reward that the pension fund desires.
By tracking the swap dealer positions we are able gain more insight into the activity of the pension funds and endowments. Their activity has placed price floors in some markets (crude for example) and in most cases (not all, but most) these positions are long only. It's worth noting that the bulk of their positions are passively managed and passively managed generally also means non-leveraged. There are however increasing cases where such funds are actively managed as well, and if/as this increases it may also impact on the volatility of the markets as well.
Conclusion
In recent years there has been some rumors floating around that the COT report was about to be pulled. I have talked with the CFTC about this and I have talked with others who have talked to the agency about this as well. My understanding is that the CFTC has no plans to pull the report. And in fact, their latest upgrades strongly suggest they are doing just the opposite. Rather than pull the report they are improving it and making it better.
The new disaggregated COT report addresses many issues associated with changing market dynamics. In just the last ten years, trading in the old open outcry trading pits has dried up. Fewer and fewer of the open outcry markets remain and most markets are traded on electronic exchanges via electronic platforms. These changes are also opening up markets to larger customers (pension funds for example) and on a global scale as well. More and more money is likely to continue pouring into these markets during the next few decades. The new improvements in the COT report have been necessary to address these changes and to keep the report valid into the 21st century.
The recent adjustments to the COT report have effectively re-aligned the commercial category with the original intention, to provide transparency into commercial hedging. In addition the new changes also provide transparency into one of the fastest growing areas of the market and that is the swaps. As such, the advantages of incorporating COT data into a trading system remain as strong as ever and, with the recent improvements described here, are probably even greater.
Trading Strategies using COT Data
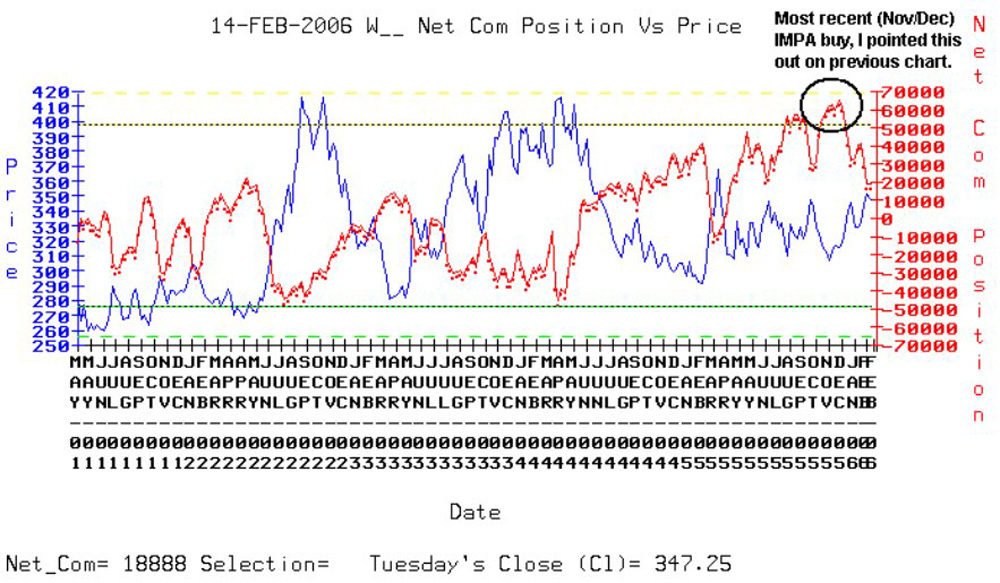
Provided below (Figure 4 below) is an example of a setup trade in Wheat during late 2005 and early 2006. The setup is for a buy. The completion of the setup relies on having both a COT trigger along with specific price criteria that confirms a change in price trend may be underway. The first step in our trading system (called "IMPA") involves an extreme position held by the commercial hedgers. When the net-commercial position exceeds a specified limit (the Upper-Commercial Limit in this case) a buy selection is triggered. Once this happens we turn our attention to the price behavior and begin looking for signs of an impending change in trend, which in this example was a double bottom / "W" pattern. Below is a chart that explains the intitial trigger for the buy inWheat.
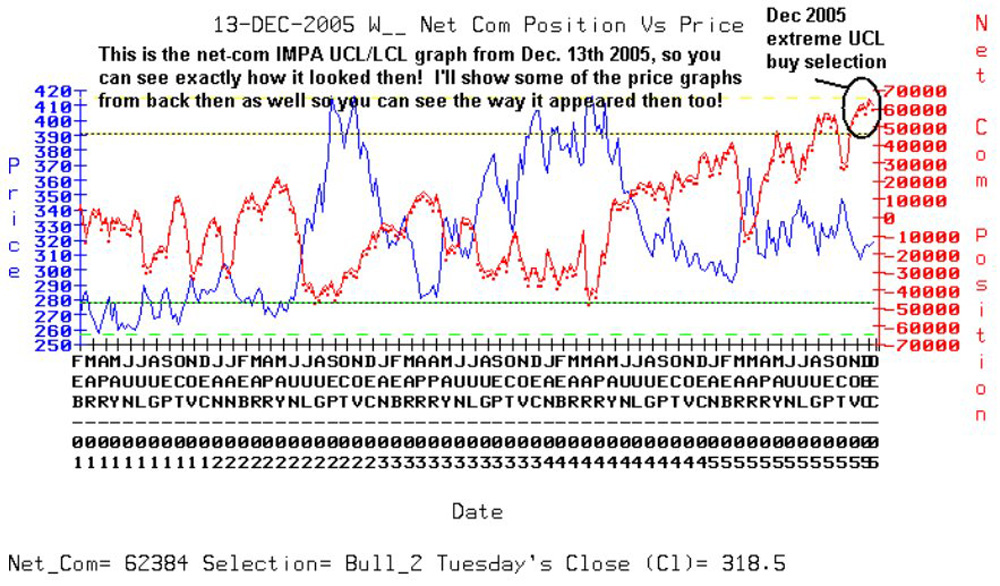
This is what the trigger graph looked like on February 14th 2006 (Figure 5 below) after the trade had been established and the new upward price trend was underway.
In Figure 6 below is one of our daily price studies in Wheat on November 30th 2005. You can see that the new price trend had not been established yet.
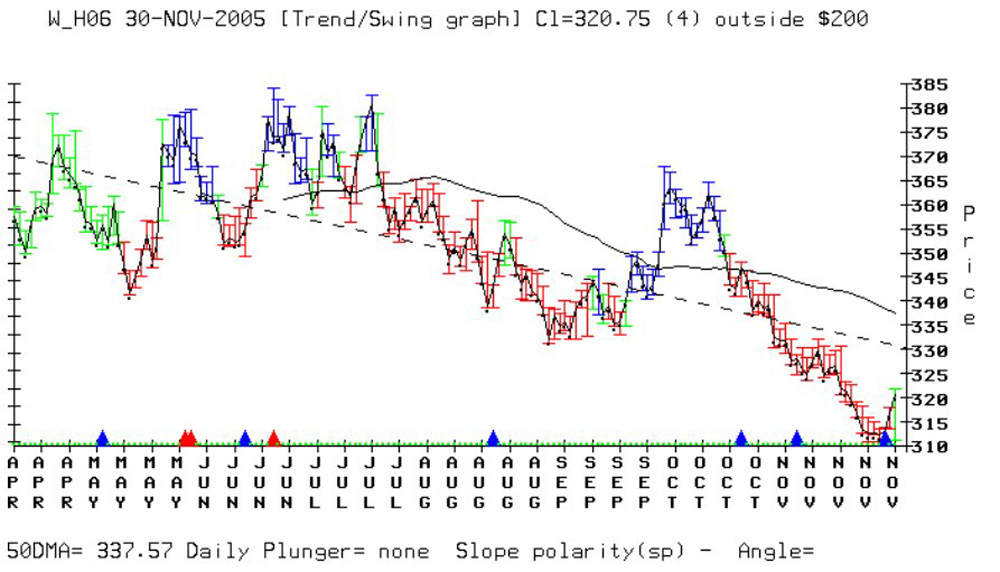
Figure 7 below shows the same graph, with the date now December 21st 2005. Here we can see a "W" price pattern has formed. The "W" price pattern is a pattern we like to see during buy selections because the price-low has already been tested once. The "W" pattern also provides an excellent logical stop (an exit if the new trend fails to unfold). We can see that the "W" lows are holding and a new price trend appears to be unfolding. The black line just above the blue closing price bars is the 50day moving average.
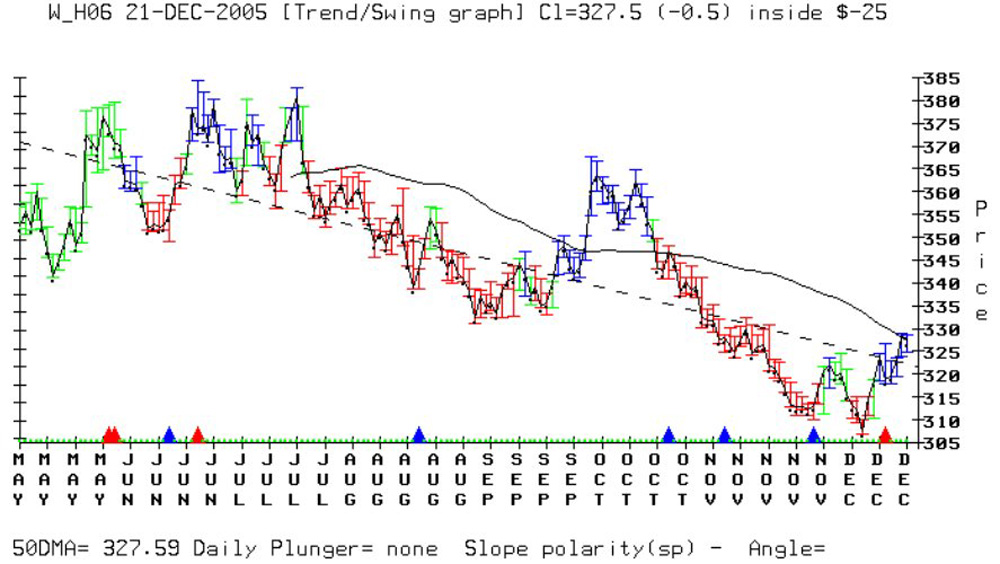
Figure 8 below is a more recent (June 2009) updated net-commercial study in Chicago Wheat and
I've circled two sell trigger selections. The first one (*huge top) occurred in 2008 and the other one at the end of June 2009.
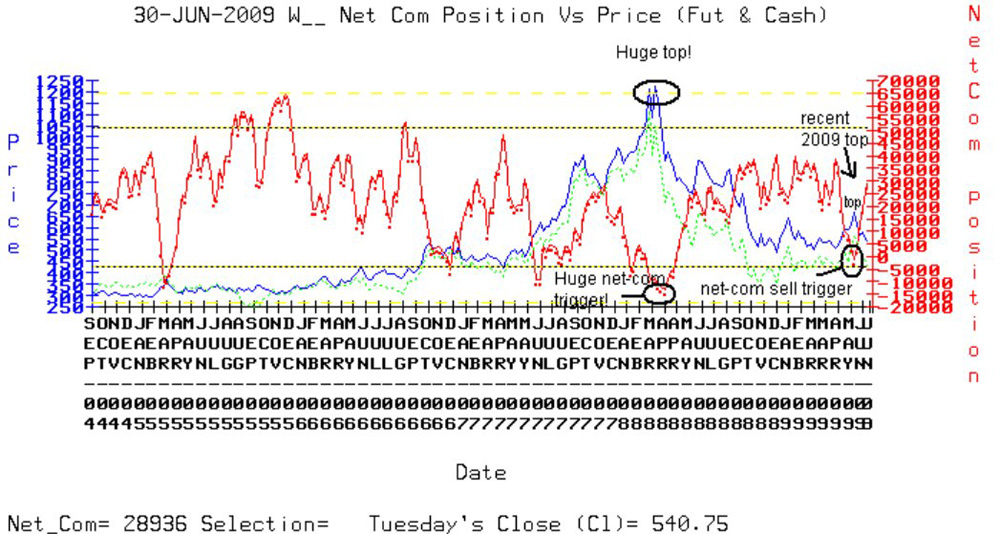
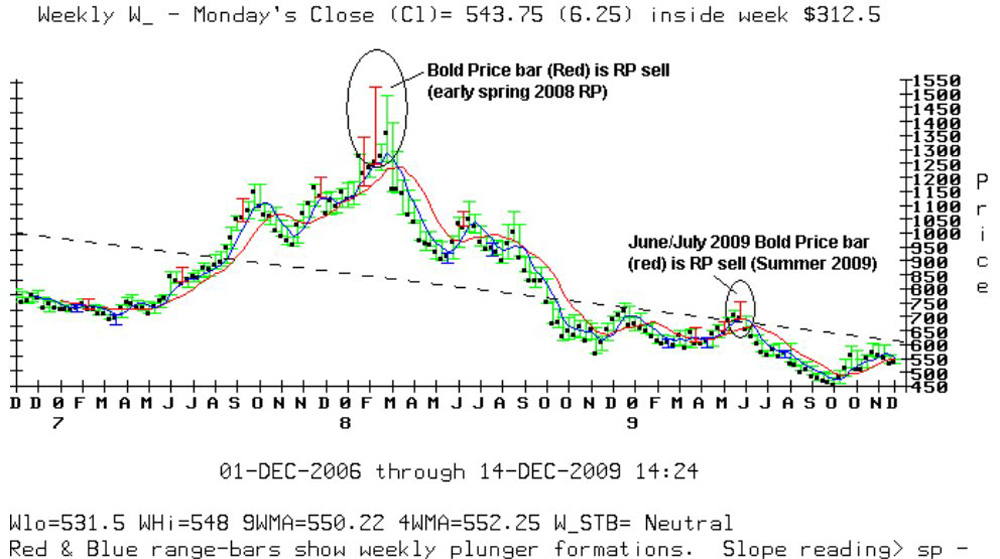
In Figure 9 below is a graph of our weekly price graph for Wheat. Here I have circled two price indicators that gave us sell signals
during the time of the trigger selections noted in the net-commercial graph above. These red price bars occurred in conjunction with the extreme commercial sell triggers.
The red price bars are a proprietary indicator known as weekly Reverse Plunger (RP) formations.
More details can be found by contacting Floyd Upperman at Floyd Upperman & Associates
Last edited by a moderator: