jungles
Guest
- Messages
- 614
- Likes
- 67
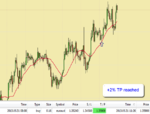
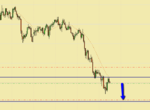
This thread will record my testing of a simple strategy, taking trades after a bounce off a 21SMA, 60M.
Whilst the bounce is the signal to take notice, the strategy also relies heavily upon reading PA and SR.
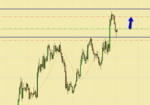
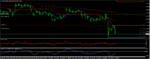
In the trade shown below, taken Friday, we have a bounce off the 21SMA (blue arrow), a good up trend (higher highs, higher lows), and no resistance at/ near entry.
The +2% TP was reached.
I have no idea if this strategy will deliver an edge.........more live trades testing this simple strategy starting next week.
.
Whilst the bounce is the signal to take notice, the strategy also relies heavily upon reading PA and SR.
In the trade shown below, taken Friday, we have a bounce off the 21SMA (blue arrow), a good up trend (higher highs, higher lows), and no resistance at/ near entry.
The +2% TP was reached.
I have no idea if this strategy will deliver an edge.........more live trades testing this simple strategy starting next week.
.