Introduction to Fractals
When people hear the word "fractal," they often think about complex mathematics. That is not what we are talking about here. Fractals also refer to a recurring pattern that occurs amid larger more chaotic price movements.
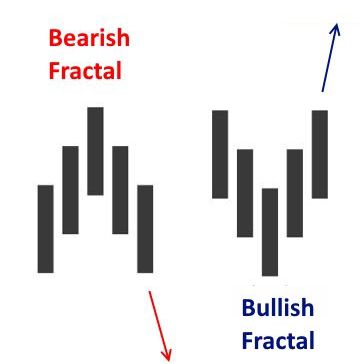
Fractals are composed of five or more bars. The rules for identifying fractals are as follows:
- A bearish turning point occurs when there is a pattern with the highest high in the middle and two lower highs on each side.
- A bullish turning point occurs when there is a pattern with the lowest low in the middle and two higher lows on each side.
The fractals shown below are two examples of perfect patterns. Note that many other less perfect patterns can occur, but this basic pattern should remain intact for the fractal to be valid.
The obvious drawback here is that fractals are lagging indicators. A fractal can't be drawn until we are two days into the reversal. However, most significant reversals will continue for more bars, benefiting the trader. Once the pattern occurs, the price is expected to rise following a bullish fractal, or fall following a bearish fractal.
Applying Fractals to Trading
Most charting platforms now provide fractals as a trading indicator. This means traders don't need to hunt for the pattern. Apply the indicator to the chart, and the software will highlight all the patterns. Upon doing this, traders will notice an immediate problem: this pattern occurs frequently.
Fractals are best used in conjunction with other indicators or forms of analysis. A common confirmation indicator used with fractals is the alligator. It's a tool created by using multiple moving averages. On the chart below is a long-term uptrend with the price staying predominantly above the alligator's teeth (middle moving average). Since the trend is up, bullish signals could be used to generate buy signals.
While slightly confusing, a bearish fractal is typically drawn on a chart with an up arrow above it. Bullish fractals are drawn with a down arrow below them. Therefore, if using fractals in an overall uptrend, look for the down fractal arrows (if using a fractal indicator provided in most charting platforms). If looking for bearish fractals to trade in a larger downtrend, look for up fractal arrows.
Sometimes switching to a longer time frame will reduce the number fractal signals, allowing for a cleaner look to the chart, making it easier to spot trading opportunities.
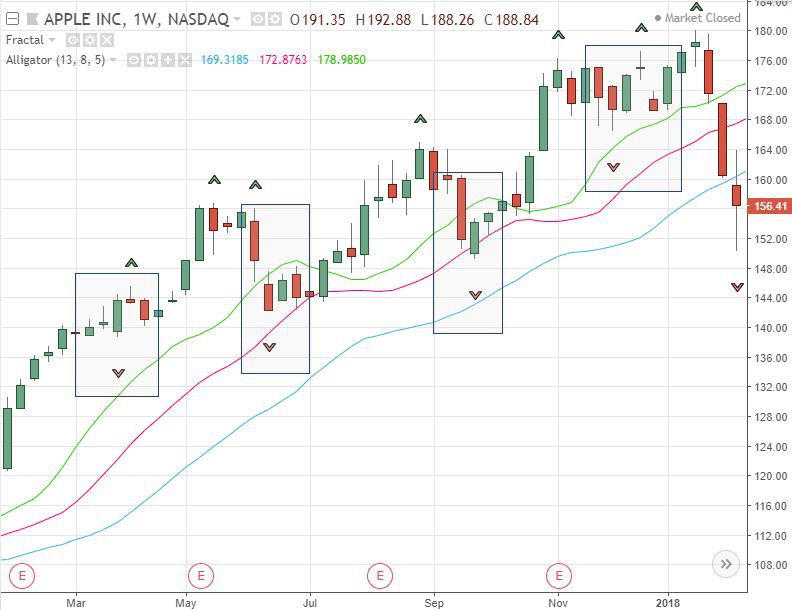
This system provides entries, but it is up to the trader to control risk. In the case above, the pattern isn't recognized until the price has started to rise off a recent low. Therefore, a stop loss could be placed below a recent low once a trade is a taken. If going short, during a downtrend, a stop loss could be placed above the recent high. This is just one example of where to place a stop loss.
Another strategy is to use fractals with Fibonacci retracement levels. One of the issues with fractals is which one of the occurrences to trade. And one of the problems with Fibonacci retracement levels is which retracement level to use. By combining the two, it will narrow down the possibilities, since a Fibonacci level will only be traded if a fractal reversal occurs off that level.
Traders also tend to focus on trades at certain Fibonacci ratios. This may vary by trader, but say a trader prefers to take long trades, during a larger uptrend, when the price pulls back to the 61.8% retracement level. Fractals could be added to the strategy: the trader only takes trades if a fractal reversal occurs near the 61.8% retracement, with all the other conditions being met.
The chart below shows this in action. The price is in an overall uptrend, and then pulls back. The price forms a bullish fractal reversal near the 0.618 level of the Fibonacci retracement tool. Once the fractal is visible (two days after the low), a long trade is initiated in alignment with the longer-term uptrend.
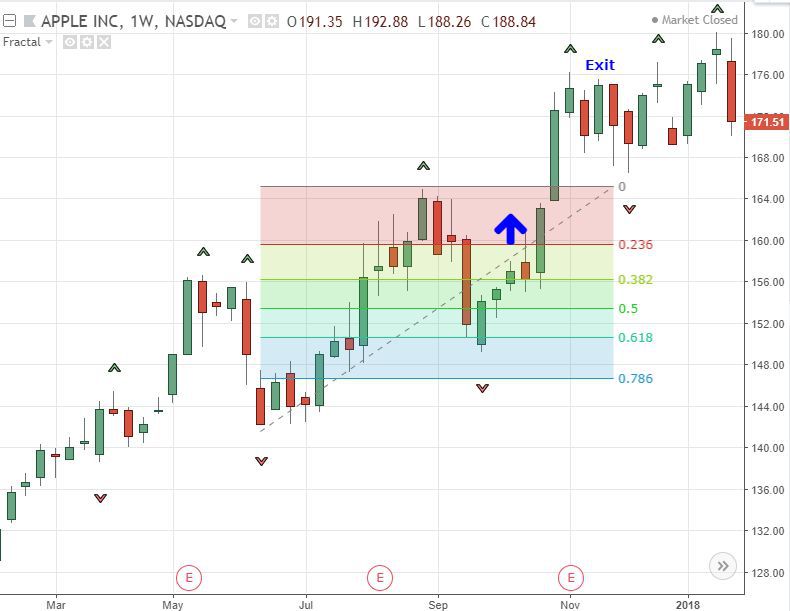
Taking profits could also involve the use of fractals. For example, if going long on a bullish fractal, a trader could exit the position once a bearish fractal occurs. Other exits methods could also be used, such as profit targets or a trailing stop loss.
Further Considerations on Using Fractals
Here are a few things to remember when using fractals.
- They are lagging indicators.
- Since fractals are very common, they are best combined with other indicators or strategies. They are not to be relied on in isolation.
- The longer the time period of the chart, the more reliable the reversal. It's also important to note that the longer the time period, the lower the number of signals generated.
- It is best to plot fractals in multiple time frames. For example, only trade short-term fractals in the direction of the long-term ones. As discussed, focus on long trade signals during larger uptrends, and focus on short trade signals during larger downtrends.
- Most charting platforms now include fractals in the indicator list.
In Summary
Fractals may be useful tools when used in conjunction with other indicators and techniques. Fractals can be used in many different ways, and each trader may find their own variation. Using an alligator indicator is one option, and another is using Fibonacci retracement levels. While some traders may like fractals, others may not. They are not a requirement for successful trading and should not be relied on exclusively
Cory Mitchell can be contacted at Vantage Point Trading
Last edited by a moderator: