Formula
The most common formula takes the last 50 price bars and divides by the total. This yields the 50-day simple moving average (SMA) used by technicians for many decades. The calculation has been tweaked in many ways over the years as market players try to build a better mousetrap. The 50-day exponential moving average (EMA) offers the most popular variation, responding to price movement more quickly than its simple minded cousin. This extra speed in signal production defines a clear advantage over the slower version, making it a superior choice. The 50-day EMA gives technicians a seat at the 50-yard line, the perfect location to watch the entire playing field for mid-term opportunities and natural counter-swings after active trends, higher or lower. It’s also neutral ground when price action is often misinterpreted by the majority. And as our contrary market proves over and over again, the most reliable signals tend erupt when the majority is sitting on the wrong side of the action.
Uses
There are dozens of ways to use the 50-day EMA in market strategies. It works as a reality check when a position hits the magic line after a rally or selloff. It has equal benefit in lower and higher time frames, applying the indicator to intraday charts or tracking long term trends with the 50-week or 50-month version. Or play a game of pinball, trading oscillations between the 50-day EMA and longer term 200-day EMA. It even works in the arcane world of market voodoo, with 50/200 day crossovers signalling bullish golden crosses or bearish death crosses.
Pullbacks
The 50-day EMA most often comes into play when you’re positioned in a trend that turns against you in a natural counter-swing, or in reaction to an impulse that’s dragging thousands of financial instruments along for the ride. It makes sense to place a stop just across the moving average because it represents intermediate support (resistance in a downtrend) that should hold under normal tape conditions. The problem with this reasoning is it doesn’t work as intended in our volatile modern markets. The 50 and 200-day EMAs have morphed from narrow lines into broad zones in the last two decades due to aggressive stop hunting. You need to consider how deep these violations will go before placing a stop or timing an entry at or near the moving average. Patience is key in these circumstances because testing at the 50-day EMA usually resolves within three to four price bars. The trick is to stay out of the way until a) the reversal kicks in or b) the level breaks, yielding a price thrust against your position.
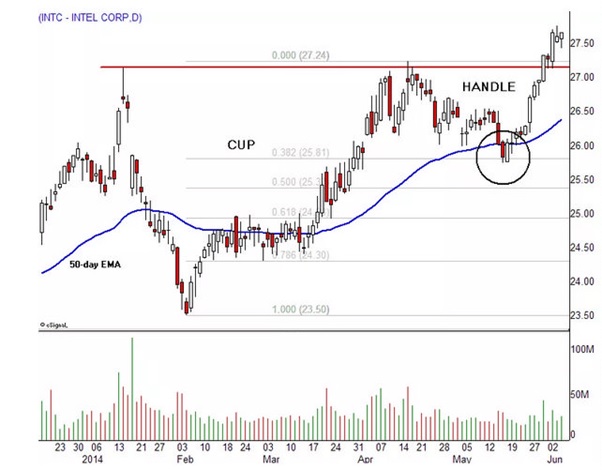
Intel Corp (INTC) Source: eSignal.com
The risk of getting it wrong will hurt your wallet, so how long should you stick around when price tests the 50-day EMA? While there’s no perfect way to avoid whipsaws, examining other technicals often pinpoints the exact extension of a reversal. For example, Intel (INTC) returned to the January high in April and sold off to the 50-day EMA. It broke support, dropped to the .386 Fibonacci rally retracement and bounced back to the moving average in the next session. The stock regained support on the third day and entered a recovery, completing a cup and handle breakout pattern.
50-Day Fractals
The moving average works just as well in lower and higher time frames. As a result, day traders will find benefit in placing 50-bar EMAs on 15 and 60 minute charts because they define natural end points for intraday oscillations. Just keep in mind that noise increases as time frame decreases, lowering its value on 5 and 1 minute charts. On the flip side, the indicator shows excellent reliability on weekly and monthly charts, often pinpointing exact turning points in corrections and long term trends.
This makes sense when considering that the 50-week EMA defines mean reversion over an entire year while the 50-month EMA tracks more than four years of market activity, approaching the average length of a typical business cycle. Market timers can use these long-term moving averages to establish profitable positions lasting for months or years while violations offer perfect levels to take profits and reallocate capital into other long term instruments.
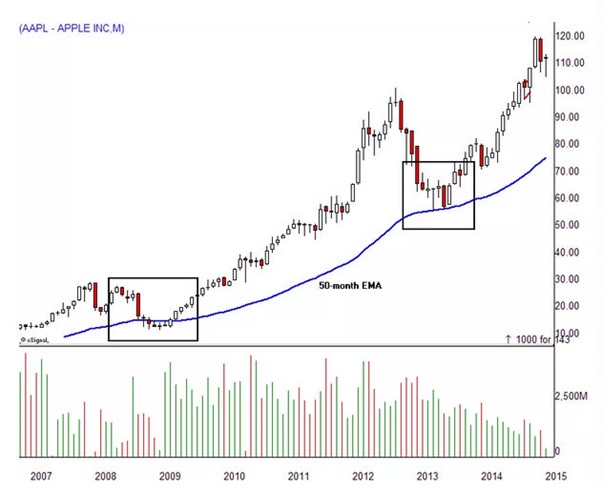
Apple Inc (AAPL) Source: eSignal.com
Apple (AAPL) set up excellent buying opportunities at the 50-month EMA in 2009 and 2013. It broke moving average support in September 2008 and spent 5 months grinding sideways before remounting that level in April 2009, issuing a “failure of a failure” buy signal that yielded more than 80 points over three years. It tested the moving average a second time in 2013, spending four months building a double bottom that triggered a 100 percent rally into 2014. Note how the lows matched support perfectly, offering an incredible low risk entry for patient market players.
50-200 Day Pinball
Fast trends in both directions tend to increase the separation between the 50 and 200-day EMAs. Once a countertrend breaks one of these averages, it often carries into the other average, setting up a few rounds of the 50-200 “pinball” strategy. Swing traders are natural beneficiaries of this two-sided technique, going long and then short until one side of the box gives way to a more active trend impulse.
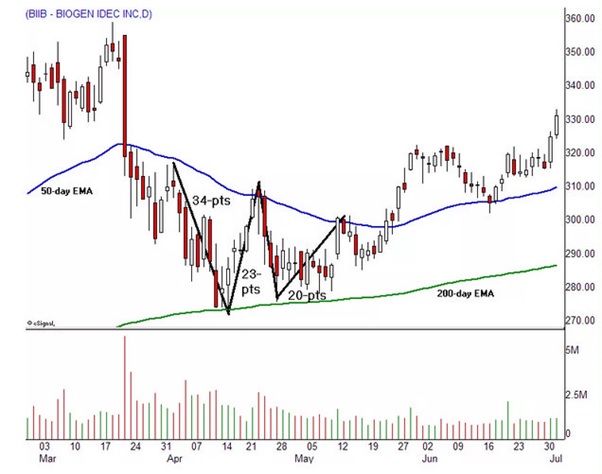
Biogen Inc (BIIB) Source: eSignal.com
Biogen (BIIB) hit a new high in March after a long uptrend and entered a steep correction that broke the 50-day EMA a few days later. Price action then entered a two month game of 50-200 pinball, traversing more than 75 points between new resistance at the 50-day EMA and long term support at the 200-day EMA. Swing reversals took place close to target numbers, allowing easy entry and relatively tight stops for a triple digit stock.
Bullish and Bearish Crossovers
The downward crossover of the 50-day EMA through the 200-day EMA signals a death cross that many technicians believe marks the end of an uptrend. An upward crossover or golden cross is alleged to possess similar magic properties in establishing a new uptrend. In reality, numerous criss-crosses can print in the life cycle of an uptrend or downtrend and these classic signals show little reliability.
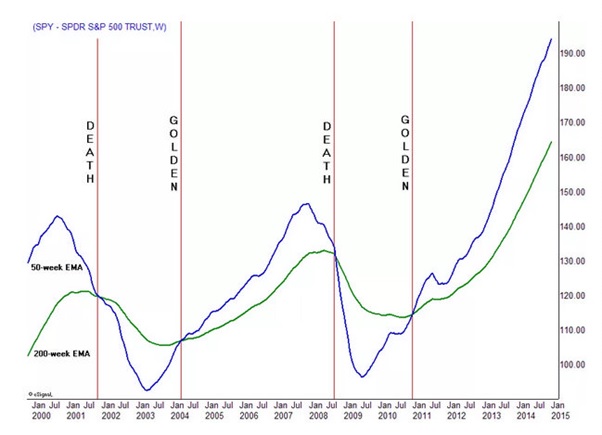
Spy (SPDR) Source: eSignal.com
It’s a different story with the 50 and 200-week EMAs. SPDR S&P Trust (SPY) shows four valid cross signals going back 15 years, two in each direction. More importantly, there were no false signals during this time, which included three bull markets and two bear markets. Looking at historic Dow Industrial data, the last invalid cross occurred more than 30 years ago, in 1982. This tells us that golden and death crosses deserve a respected place in market analysis.
In Summary
The 50-day EMA identifies a natural mean reversion level for the intermediate time frame. It has numerous applications in price prediction, position choice and strategy building. Traders, market timers and investors all benefit from 50-day EMA study, making it an indispensable ingredient in your technical market analysis.
Alan Farley can be contacted on this link: Hard Right Edge