Market Profile is a powerful statistical analysis tool developed by J. Peter Steidlmayer and the CBOT during the 1980s. This article introduces traders to the Market profile tool and goes over the basic uses and functions.
Introduction:
Market profile is a technical analysis tool developed by J. Peter Steidlmayer in conjunction with the Chicago Board of Trade in the mid 1980s. Market Profile is a statistical analysis of time and price to create a graphical representation of a trading session or multiple trading sessions. Price is plotted on the vertical axis, and time is plotted on the horizontal axis. Market Profile essentially puts a daily bar or candle under a microscope. By looking at a bar with the naked eye, all we know is where the bar opened, where the high and low were and where the bar closed. A Market Profile of that bar will let you know when the bar made the low, when it made the high and, more importantly, where the price action or Time Price Opportunities (TPO) for that bar took place.
Market Profile Construction:
A standard Market Profile assigns a letter to each 30 minute period of a session. Typically, a Market Profile will start with letter A and end with letter X. It is not required for each letter to represent a 30 minute time, this is just the default setting and most used time frame, I would not recommend using a time frame less than 15 minutes. For the purpose of this article, all examples are in a 30 minute time frame. Each letter is placed in a column next to the corresponding price. After 30 minutes, the letter changes and if the price has already touched that level, the new letter is drawn in the next column, if the price touches a new level, the letter is placed in the first column. The CBOT uses an uppercase A-X for the midnight to noon period, and a lower case a-x for the noon to midnight period. When Market Profile was first developed, most markets traded on set sessions that had an open and a close, however today many markets are open virtually 24 hours a day. This does not eliminate the usefulness of Market Profile because the same psychological factors are in place, in any market you have short term participants and you have long term participants. The concept of market profile centers around the normal distribution curve, or bell shaped curve used throughout nearly all statistical analysis.
Here is a daily candle for the e-mini S&P 500:
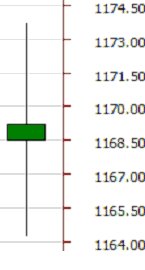
The open for this candle was 1168.50, the low was 1164.25, the high was 1173.75 and the close was 1169.50
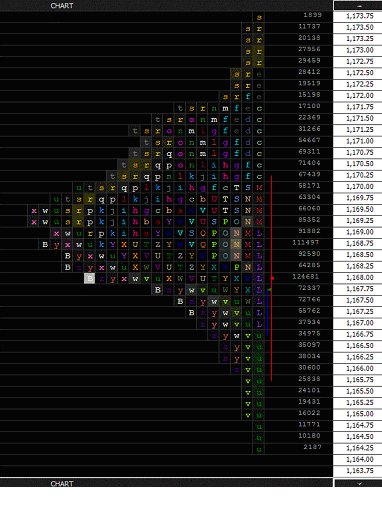
And here is the market profile of the same session:
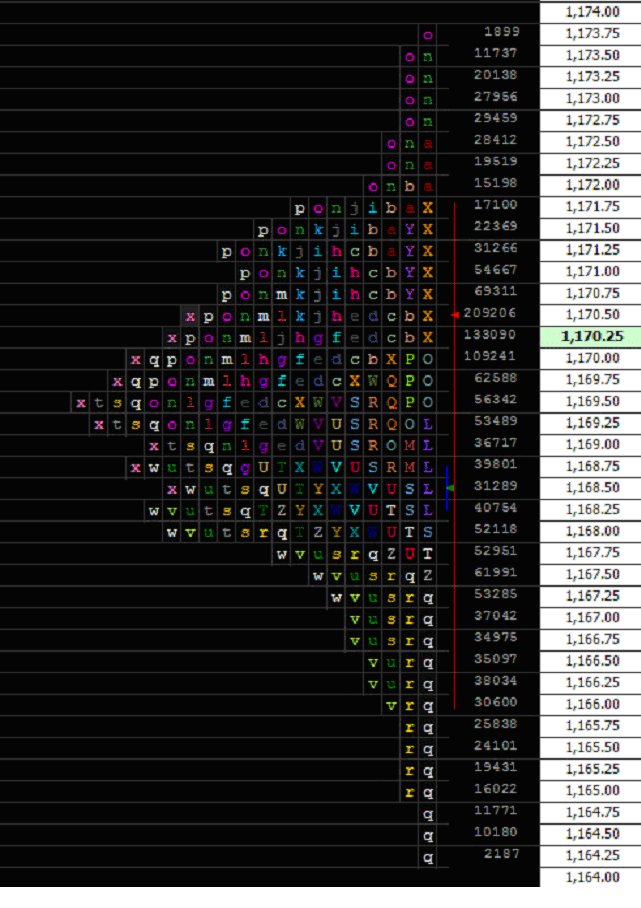
The open was 1168.50 noted by the green arrow, the high was 1173.75 noted by the highest printed letter "o", and the low was 1164.25 as noted by the lowest printed letter "q". But our market profile shows how the candle was formed, after the bar opened the opening range was tight, between 1169.25 and 1168.25 a range of just 4 ticks, then during the "q" period we made a low and during the "o" period we made our high. The value area for this session was between 1166.00 and 1171.75 noted by the red line. As the distribution of the day is normal, our support is at 1166.00 and our resistance is at 1171.75.
As you can see the day forms a nearly perfect bell shaped curve with the most price action taking place at 1169.50. As we can see when the price went above 1172 (High end of the range) it soon retraced back down and when the price went lower than 1166.25 (low end of the range) it quickly bounced back up, which can be interpreted as when the price was in the 1166.25 area buyers became attracted and when the price rose to 1172 sellers became attracted. The middle part of the curve is our balance area, where we have a relatively equal number of buyers and sellers, when the price moved outside the balance area the market reacted and the price moved back into balance.
To get a better idea of how the Market Profile is constructed, let's look at the first 2 hours of a session.
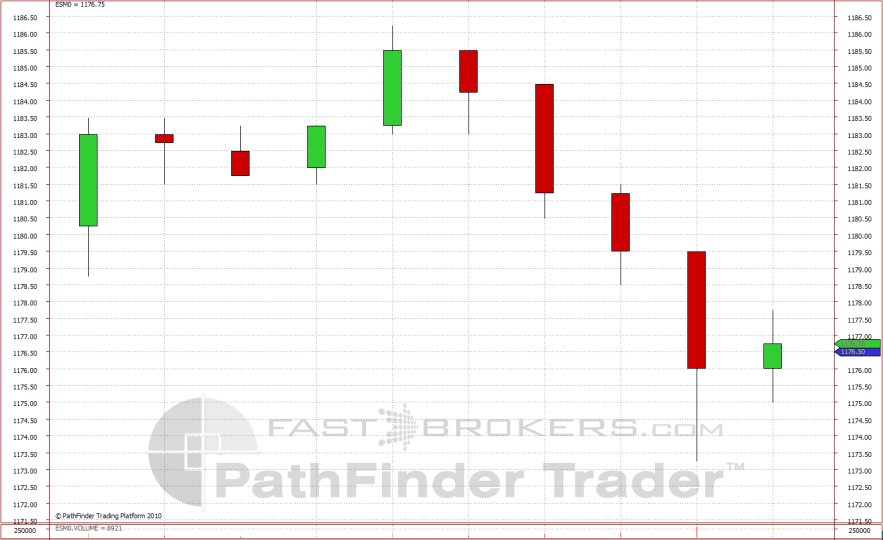
Here are 10 thirty minute bars of the ESM0 contract covering 5 hours of data:
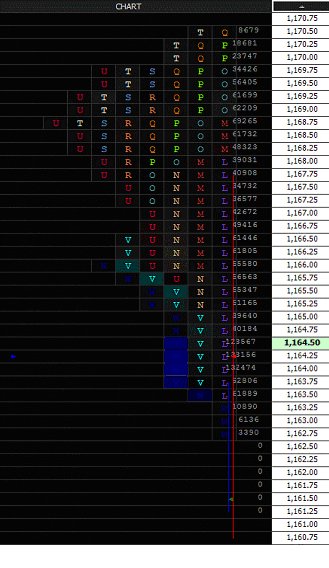
And here is the corresponding Market Profile for the same period:
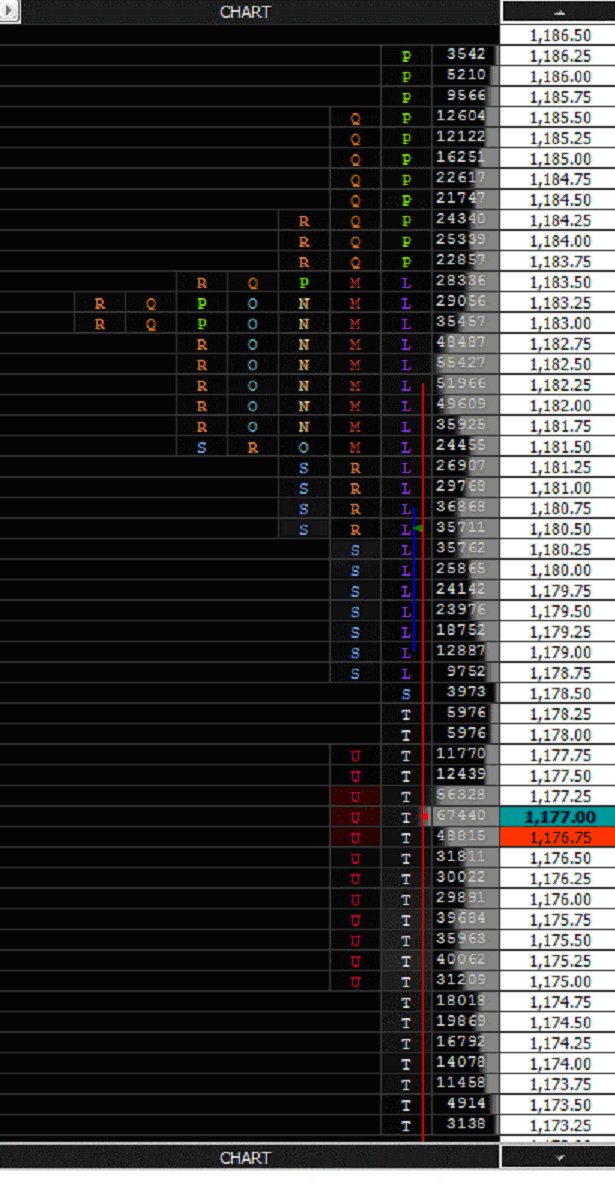
The First period is the "L" period, which had a high of 1183.50 and a low of1178.75. If we look at the oldest bar in the chart above we can see the same levels, high of 1183.50 and low of 1178.78. The next letter is "M" and it stayed within the "L" period's range which matches the chart. The "N" and "O" periods also stayed within the "L" range. During the "P" period we moved past the "L" period's high and made a new high of 1186.25 before retracing back down to 1185.50 which is where the "Q" period begins, "Q" and "R" stayed within the daily range but the "S" period made a new low of 1178.50. The "T" period made the low of the session at 1173.25 before retracing back up to 1175.00 and the "Q" period stayed within the "T" range. This session is clearly a trending session as the price moved throughout several TPOs without much resistance. We also know that the market stayed in its initial range for the first 4 bars made its high in the middle of the day and the low late in the day. Also, the 1181.50 level could be seen as resistance as we had 5 TPOs at that price.
Using Market Profile in Your Trading:
Now that we have briefly gone over the concept of Market Profile, how can we apply it to our trading? There are 2 main types of markets in terms of range development, normal or non-trending and trending. In addition to range development, market activity can be broken down into two categories initiative and responsive. If the price moves past the previous day's value area and holds there, traders are taking the initiative of moving the price into a new value area, if on the other hand the price quickly moves back down market participants are responding to the new price by rejecting it as a value area. The psychology for long term and short term trader differs depending on the range distribution. During a ranging or non-trending days the short term traders are in control. Think about it, when the price stays in a small trading range the only way to profit is to buy at the low end of the range and sell at the high end and vice versa. During a trending day, where the distribution is not normal or bell shaped the longer term traders are in control. During trending days, selling at the high end of the range does not make sense as the price will continue to trend higher, during this type of session, buying early in an uptrend and selling when the trend appears to be ending is the better strategy. Now it should be noted that short term traders and long term traders have different ideas of value. Short term traders typically go for small price movements with larger orders while swing or long term traders typically trade less volume but go for more ticks. Therefore a short term trader may see value at the low end of a ranging day, where as a long term trader may not see the same value there. Identifying the range development for the day and knowing the previous days? value area can give you an edge over traders that do not have access to this data.
Here is an example of a normal day:
And here is an example of a trending day:
As you can see during the normal day, once the range was established, buying the low end of the range and shorting the high end was a good strategy, during the trending day though if you tried buying at the low end of the range, the market kept moving lower resulting in a loss.
Where can I get Market Profile Data?
Many software vendors have Market Profile data but it can be costly. Our company has a proprietary trading platform that provides free market profile data. Please contact us for more information.
This was a brief introduction to Market Profile. There is much more to this powerful tool and if you would like more information please visit the CME website: CME Market Profile
Jesse Richards can be contacted at Fast Trading Services LLC
Introduction:
Market profile is a technical analysis tool developed by J. Peter Steidlmayer in conjunction with the Chicago Board of Trade in the mid 1980s. Market Profile is a statistical analysis of time and price to create a graphical representation of a trading session or multiple trading sessions. Price is plotted on the vertical axis, and time is plotted on the horizontal axis. Market Profile essentially puts a daily bar or candle under a microscope. By looking at a bar with the naked eye, all we know is where the bar opened, where the high and low were and where the bar closed. A Market Profile of that bar will let you know when the bar made the low, when it made the high and, more importantly, where the price action or Time Price Opportunities (TPO) for that bar took place.
Market Profile Construction:
A standard Market Profile assigns a letter to each 30 minute period of a session. Typically, a Market Profile will start with letter A and end with letter X. It is not required for each letter to represent a 30 minute time, this is just the default setting and most used time frame, I would not recommend using a time frame less than 15 minutes. For the purpose of this article, all examples are in a 30 minute time frame. Each letter is placed in a column next to the corresponding price. After 30 minutes, the letter changes and if the price has already touched that level, the new letter is drawn in the next column, if the price touches a new level, the letter is placed in the first column. The CBOT uses an uppercase A-X for the midnight to noon period, and a lower case a-x for the noon to midnight period. When Market Profile was first developed, most markets traded on set sessions that had an open and a close, however today many markets are open virtually 24 hours a day. This does not eliminate the usefulness of Market Profile because the same psychological factors are in place, in any market you have short term participants and you have long term participants. The concept of market profile centers around the normal distribution curve, or bell shaped curve used throughout nearly all statistical analysis.
Here is a daily candle for the e-mini S&P 500:
The open for this candle was 1168.50, the low was 1164.25, the high was 1173.75 and the close was 1169.50
And here is the market profile of the same session:
The open was 1168.50 noted by the green arrow, the high was 1173.75 noted by the highest printed letter "o", and the low was 1164.25 as noted by the lowest printed letter "q". But our market profile shows how the candle was formed, after the bar opened the opening range was tight, between 1169.25 and 1168.25 a range of just 4 ticks, then during the "q" period we made a low and during the "o" period we made our high. The value area for this session was between 1166.00 and 1171.75 noted by the red line. As the distribution of the day is normal, our support is at 1166.00 and our resistance is at 1171.75.
As you can see the day forms a nearly perfect bell shaped curve with the most price action taking place at 1169.50. As we can see when the price went above 1172 (High end of the range) it soon retraced back down and when the price went lower than 1166.25 (low end of the range) it quickly bounced back up, which can be interpreted as when the price was in the 1166.25 area buyers became attracted and when the price rose to 1172 sellers became attracted. The middle part of the curve is our balance area, where we have a relatively equal number of buyers and sellers, when the price moved outside the balance area the market reacted and the price moved back into balance.
To get a better idea of how the Market Profile is constructed, let's look at the first 2 hours of a session.
Here are 10 thirty minute bars of the ESM0 contract covering 5 hours of data:
And here is the corresponding Market Profile for the same period:
The First period is the "L" period, which had a high of 1183.50 and a low of1178.75. If we look at the oldest bar in the chart above we can see the same levels, high of 1183.50 and low of 1178.78. The next letter is "M" and it stayed within the "L" period's range which matches the chart. The "N" and "O" periods also stayed within the "L" range. During the "P" period we moved past the "L" period's high and made a new high of 1186.25 before retracing back down to 1185.50 which is where the "Q" period begins, "Q" and "R" stayed within the daily range but the "S" period made a new low of 1178.50. The "T" period made the low of the session at 1173.25 before retracing back up to 1175.00 and the "Q" period stayed within the "T" range. This session is clearly a trending session as the price moved throughout several TPOs without much resistance. We also know that the market stayed in its initial range for the first 4 bars made its high in the middle of the day and the low late in the day. Also, the 1181.50 level could be seen as resistance as we had 5 TPOs at that price.
Using Market Profile in Your Trading:
Now that we have briefly gone over the concept of Market Profile, how can we apply it to our trading? There are 2 main types of markets in terms of range development, normal or non-trending and trending. In addition to range development, market activity can be broken down into two categories initiative and responsive. If the price moves past the previous day's value area and holds there, traders are taking the initiative of moving the price into a new value area, if on the other hand the price quickly moves back down market participants are responding to the new price by rejecting it as a value area. The psychology for long term and short term trader differs depending on the range distribution. During a ranging or non-trending days the short term traders are in control. Think about it, when the price stays in a small trading range the only way to profit is to buy at the low end of the range and sell at the high end and vice versa. During a trending day, where the distribution is not normal or bell shaped the longer term traders are in control. During trending days, selling at the high end of the range does not make sense as the price will continue to trend higher, during this type of session, buying early in an uptrend and selling when the trend appears to be ending is the better strategy. Now it should be noted that short term traders and long term traders have different ideas of value. Short term traders typically go for small price movements with larger orders while swing or long term traders typically trade less volume but go for more ticks. Therefore a short term trader may see value at the low end of a ranging day, where as a long term trader may not see the same value there. Identifying the range development for the day and knowing the previous days? value area can give you an edge over traders that do not have access to this data.
Here is an example of a normal day:
And here is an example of a trending day:
As you can see during the normal day, once the range was established, buying the low end of the range and shorting the high end was a good strategy, during the trending day though if you tried buying at the low end of the range, the market kept moving lower resulting in a loss.
Where can I get Market Profile Data?
Many software vendors have Market Profile data but it can be costly. Our company has a proprietary trading platform that provides free market profile data. Please contact us for more information.
This was a brief introduction to Market Profile. There is much more to this powerful tool and if you would like more information please visit the CME website: CME Market Profile
Jesse Richards can be contacted at Fast Trading Services LLC
Last edited by a moderator: