What is Market Profile?
Everyone has seen conventional volume displayed as a vertical bar underneath the price bar. But the most important information that this cumulative tally of total volume omits to tell you is at what individual prices the trades that make up this volume were traded at. Knowing what prices traded the biggest volume can give you a significant edge with regards to understanding what price levels traders see as significant now, and likely will again if market price trades back in the same area.
In its simplest form,
Market Profile is a graphical organisation of price, volume and time information. Market Profile displays price on the vertical axis and volume/time on the horizontal axis. In the conventional legacy approach to charting Market Profile, letters are used to symbolize time intervals and volume traded (see Fig. 1 below).
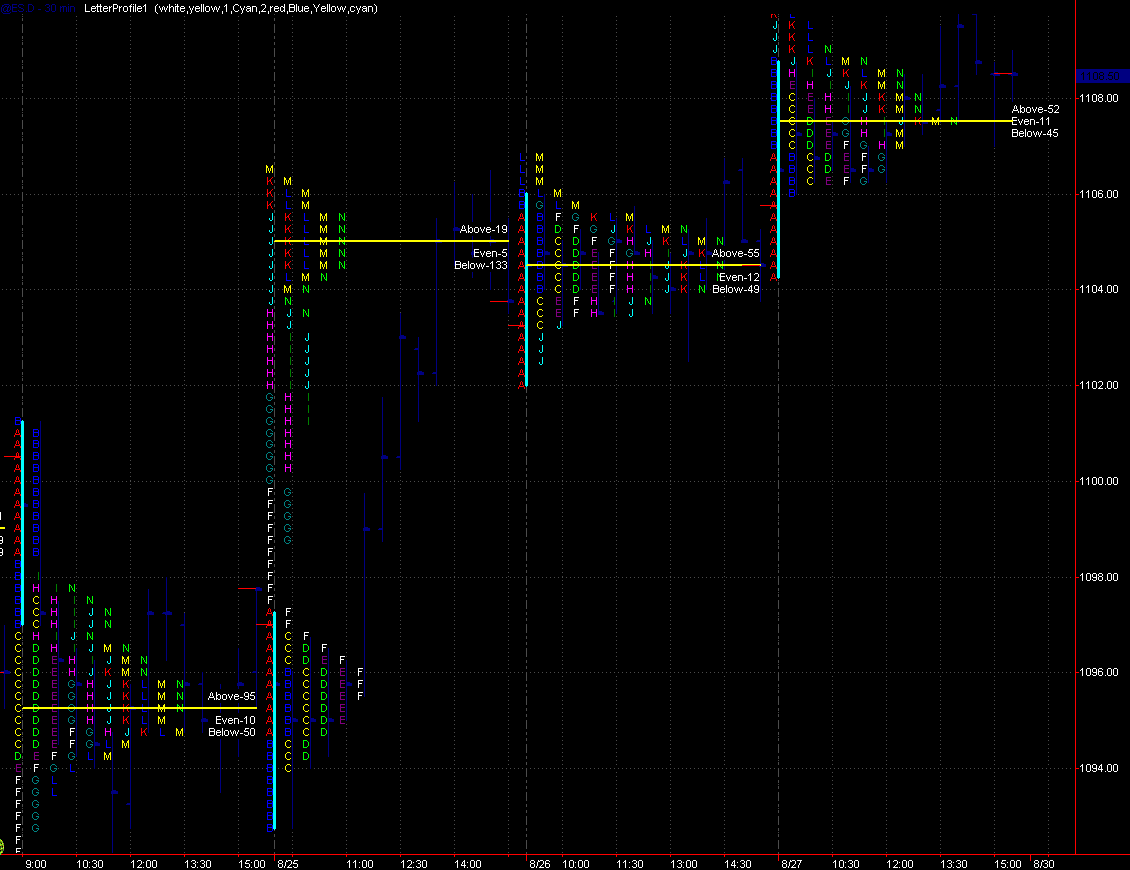
caption: Fig. 1
This approach of letter based market profile was conceptualised and developed in the 1980s and trademarked by the Chicago Board of Trade. It originating back in the days before city pit traders had instant access to a computer screen or chart on the dealing floor. In order to get the volume data showing which prices traded what volume at what times, traders would print the market profile letter based chart onto a sheet of paper which they could then put in their pocket and use in the pit.
The computer screen as opposed to the dealing floor pit is now establishing itself as the most efficient means of trading, but analysing volume at price data can still be used very effectively by both screen traders and pit alike for significant advantages.
Market Profile reveals pricing patterns, from any market, as they develop. By effectively organizing price and time information, it is possible for traders to see which price areas the market is accepting or which ones it is rejecting? and adjust their trading styles accordingly.
The Markets' perceived value
A price level that has been confirmed over time takes on added meaning. A price that is touched only briefly and trades low volumes at that level is just a price and little more. Confirmed by time and traded volume, however, traders collectively reveal how the market values that price.
The Markets' perceived value to the biggest number of traders is ultimately the key to anticipating where price is likely to move. In order for the price to move there must be an imbalance between supply and demand. Current market price will naturally gravitate towards price points that attract high volumes of trades because in order for there to be equilibrium between buyers and sellers, prices have to be reduced or increased to the point where the new lower or higher value will bring sufficient buying or selling activity to meet demand. If the increased activity at the new price balances enough sellers to buyers, then an up move will come to an end, and vice versa.
It is simple supply and demand, but market profile can give you an edge in seeing where additional buyers or sellers have, and are likely to again, join the bid or the offer to counter a current price move. Market Profile will also show the price areas where participants have not previously engaged in significant volumes of trading and hence where any moving price is unlikely to meet support or resistance through additional supply or demand.
Using peak volume prices to establish key support & resistance
Charting packages such as TradeStation now have add-ons for displaying both conventional letter style market profile and histogram based volume at price data. Screen traders who dont want to get into learning the whole approach of understanding a jumble of coloured letters on a chart can simply eyeball price data and see which levels traded significant volume and at what time by comparing the horizontal volume bar lengths (see Fig. 2 below).
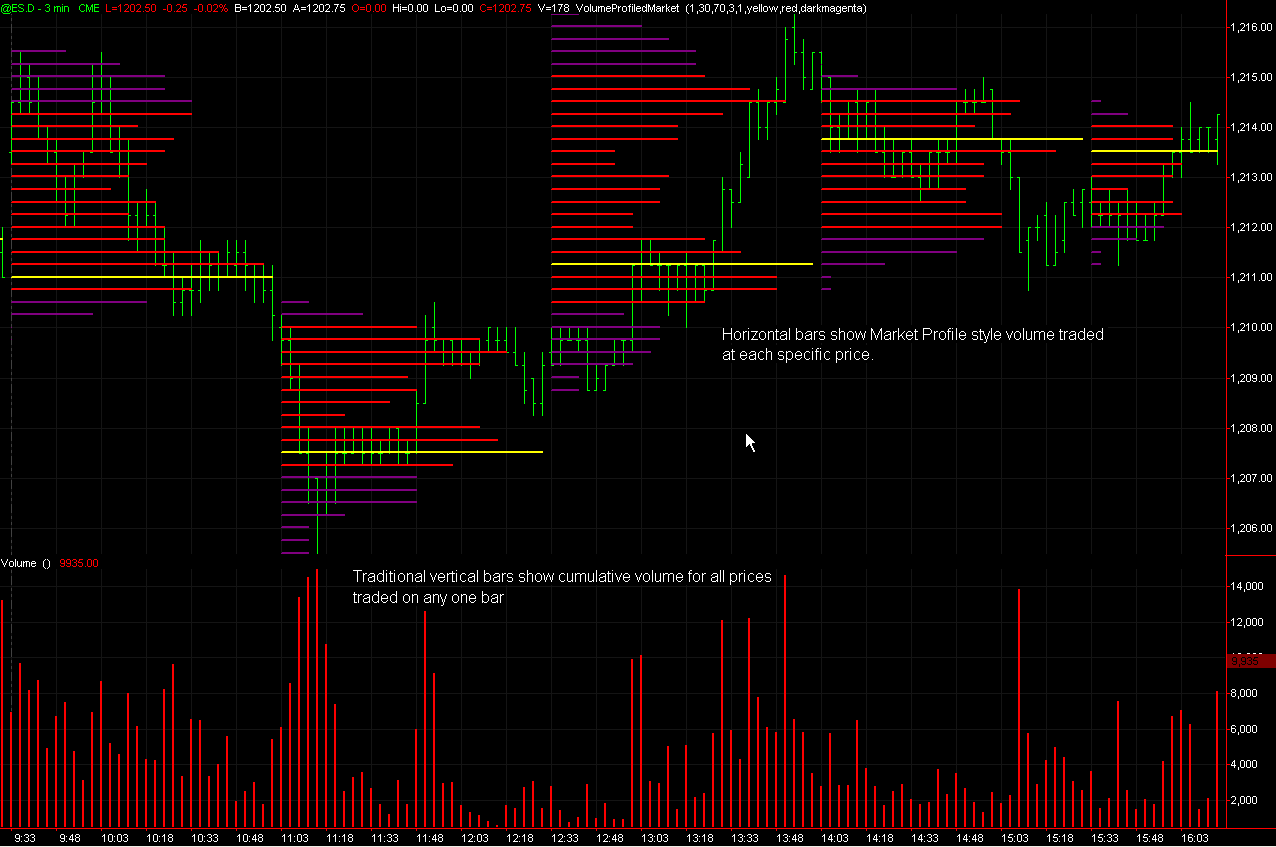
caption: Figure 2
This simple approach to Market Profile can reveal support & resistance data that is vastly superior to any fibonacci levels, calculated pivot points or gann lines, since it shows at which price levels the maximum number of traders participated in the market - as opposed to some potentially asbstract fibonacci line drawn at a level that may have no significance to anyone else other than you. The chart in Fig. 3 (below) shows a simple histogram based market profile analysis of 15 min intervals on a 3 min intraday chart in the e-mini S&P future.
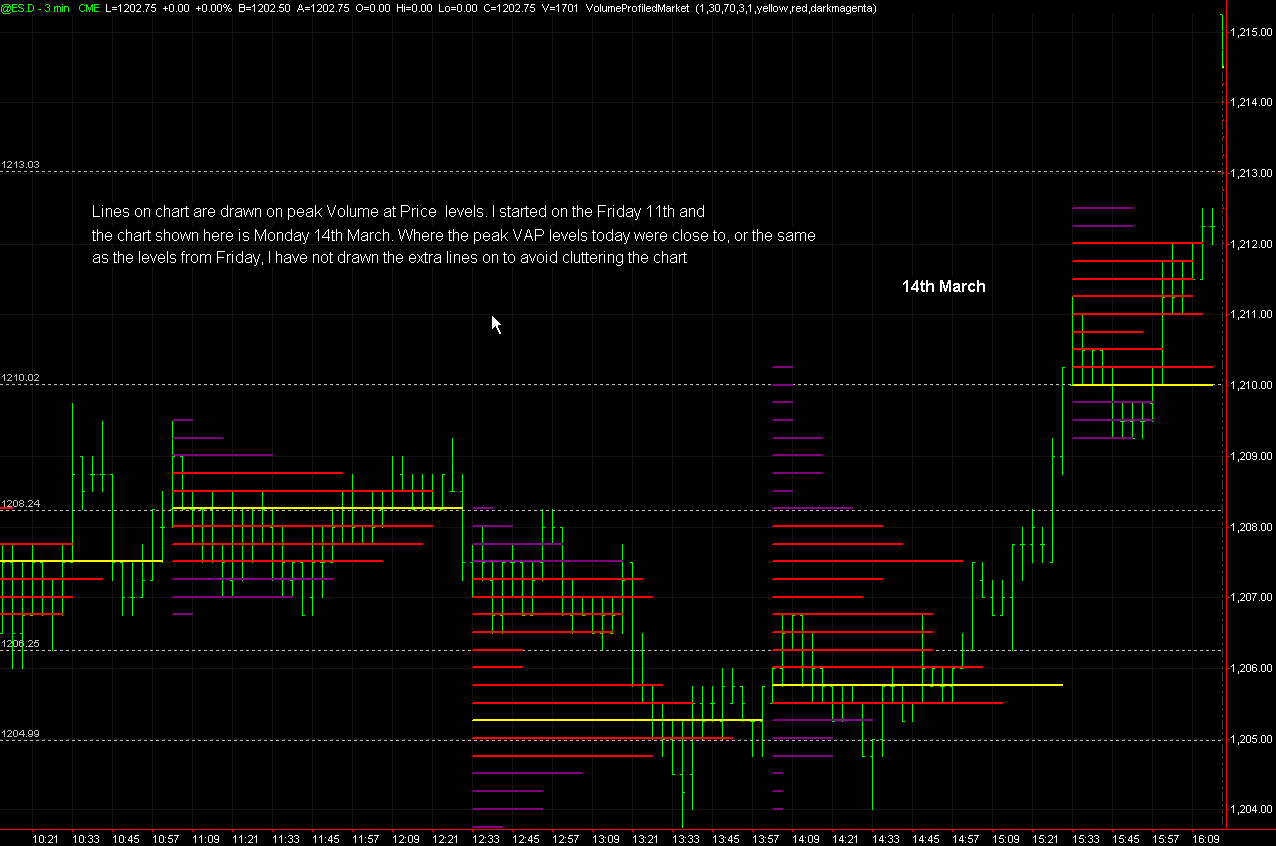
caption: Fig. 3
By drawing a line on the chart at the price points that traded the peak number of contracts for each 15 minute interval analysed, it is possible to establish levels that market participants hold as significant, and you can see from the illustration in Fig. 4 (below) how market movement reacts to these price levels on the following day.
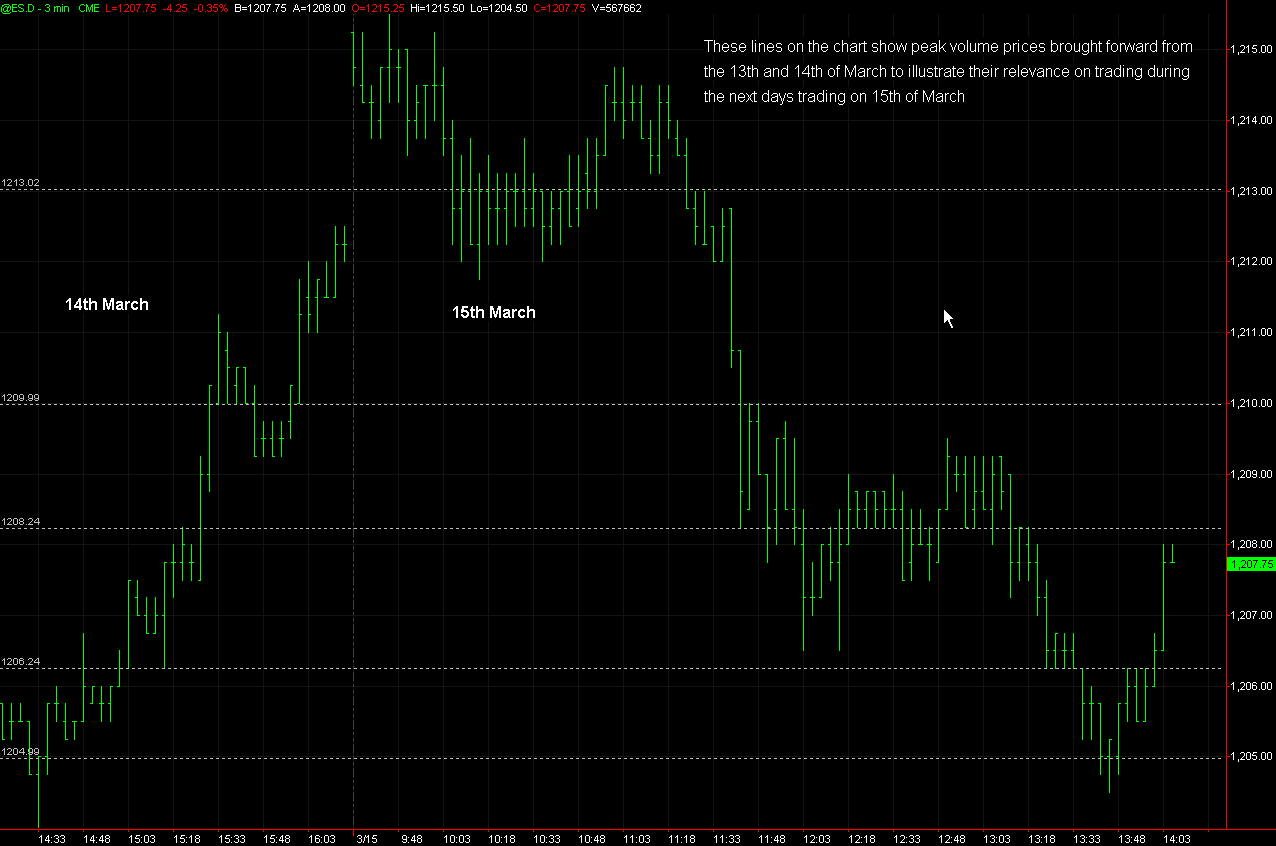
caption: Figure 4
An edge in any market, any timeframe
Another reason why Market Profile is so effective is because it works on any market, and on any time frame, from short intraday intervals right up to daily and weekly price bars. Better still, volume at price can be used in conjunction with your existing trading methods to give you a valuable extra context to market price movement that can only help to improve your trading edge.
Everyone has seen conventional volume displayed as a vertical bar underneath the price bar. But the most important information that this cumulative tally of total volume omits to tell you is at what individual prices the trades that make up this volume were traded at. Knowing what prices traded the biggest volume can give you a significant edge with regards to understanding what price levels traders see as significant now, and likely will again if market price trades back in the same area.
In its simplest form,
Market Profile is a graphical organisation of price, volume and time information. Market Profile displays price on the vertical axis and volume/time on the horizontal axis. In the conventional legacy approach to charting Market Profile, letters are used to symbolize time intervals and volume traded (see Fig. 1 below).
caption: Fig. 1
This approach of letter based market profile was conceptualised and developed in the 1980s and trademarked by the Chicago Board of Trade. It originating back in the days before city pit traders had instant access to a computer screen or chart on the dealing floor. In order to get the volume data showing which prices traded what volume at what times, traders would print the market profile letter based chart onto a sheet of paper which they could then put in their pocket and use in the pit.
The computer screen as opposed to the dealing floor pit is now establishing itself as the most efficient means of trading, but analysing volume at price data can still be used very effectively by both screen traders and pit alike for significant advantages.
Market Profile reveals pricing patterns, from any market, as they develop. By effectively organizing price and time information, it is possible for traders to see which price areas the market is accepting or which ones it is rejecting? and adjust their trading styles accordingly.
The Markets' perceived value
A price level that has been confirmed over time takes on added meaning. A price that is touched only briefly and trades low volumes at that level is just a price and little more. Confirmed by time and traded volume, however, traders collectively reveal how the market values that price.
The Markets' perceived value to the biggest number of traders is ultimately the key to anticipating where price is likely to move. In order for the price to move there must be an imbalance between supply and demand. Current market price will naturally gravitate towards price points that attract high volumes of trades because in order for there to be equilibrium between buyers and sellers, prices have to be reduced or increased to the point where the new lower or higher value will bring sufficient buying or selling activity to meet demand. If the increased activity at the new price balances enough sellers to buyers, then an up move will come to an end, and vice versa.
It is simple supply and demand, but market profile can give you an edge in seeing where additional buyers or sellers have, and are likely to again, join the bid or the offer to counter a current price move. Market Profile will also show the price areas where participants have not previously engaged in significant volumes of trading and hence where any moving price is unlikely to meet support or resistance through additional supply or demand.
Using peak volume prices to establish key support & resistance
Charting packages such as TradeStation now have add-ons for displaying both conventional letter style market profile and histogram based volume at price data. Screen traders who dont want to get into learning the whole approach of understanding a jumble of coloured letters on a chart can simply eyeball price data and see which levels traded significant volume and at what time by comparing the horizontal volume bar lengths (see Fig. 2 below).
caption: Figure 2
This simple approach to Market Profile can reveal support & resistance data that is vastly superior to any fibonacci levels, calculated pivot points or gann lines, since it shows at which price levels the maximum number of traders participated in the market - as opposed to some potentially asbstract fibonacci line drawn at a level that may have no significance to anyone else other than you. The chart in Fig. 3 (below) shows a simple histogram based market profile analysis of 15 min intervals on a 3 min intraday chart in the e-mini S&P future.
caption: Fig. 3
By drawing a line on the chart at the price points that traded the peak number of contracts for each 15 minute interval analysed, it is possible to establish levels that market participants hold as significant, and you can see from the illustration in Fig. 4 (below) how market movement reacts to these price levels on the following day.
caption: Figure 4
An edge in any market, any timeframe
Another reason why Market Profile is so effective is because it works on any market, and on any time frame, from short intraday intervals right up to daily and weekly price bars. Better still, volume at price can be used in conjunction with your existing trading methods to give you a valuable extra context to market price movement that can only help to improve your trading edge.
Last edited by a moderator: