A view of the forest (from the top of the tallest tree)
There was a time when volume data wasn’t available until a day or days after a trade. But in today’s electronic age, live volume is at our fingertips. The beauty of volume as an indicator in live trading is the fact that it is the ONLY leading indicator among the hundreds of possibles. Everything else derives value from what price is doing, lagging the price action. That means changes in volume can impact what price will do before it happens.
Volume plays such an important role in our trading, we mustn’t neglect the messages it sends. For example, one key to this important strategy is the function of volume spikes. It is these spikes that suggest possible market turns. The chart below is a shot of the SP-500 index, clearly demonstrating how volume spikes foretell changes in the very recent trends. This is a weekly chart providing a larger picture of the action.
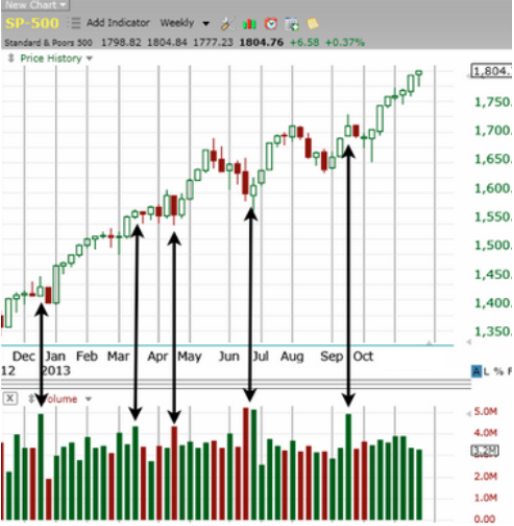
Fig. 1 SP-500 Weekly Price-bars with Volume.
The same phenomena is present in Daily price bars as shown by the next graphic on a single stock pattern.
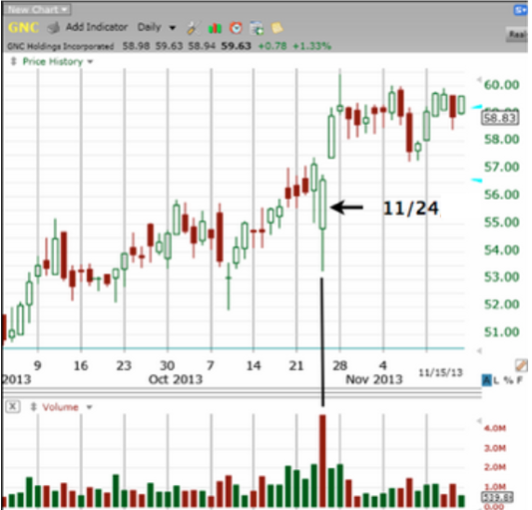
Fig. 2 Price and Volume action on GNC.
To make the graphic clear, look at what the price bar did on that day (11/24). The volume bar is red because the price closed lower than on the previous day. The price bar on that day is open (green) since the closing price was greater than its open. It was internally an up day, though it was not as high as the day before. From a “top of the trees” perspective, the market was down on that day. But the dramatic volume spike suggested that a change was in the works. Volume does send messages! Let’s examine the day highlighted for a better view of the forest, to understand what took place on that day. Look at the following 30-minute chart on that same day (11/24).
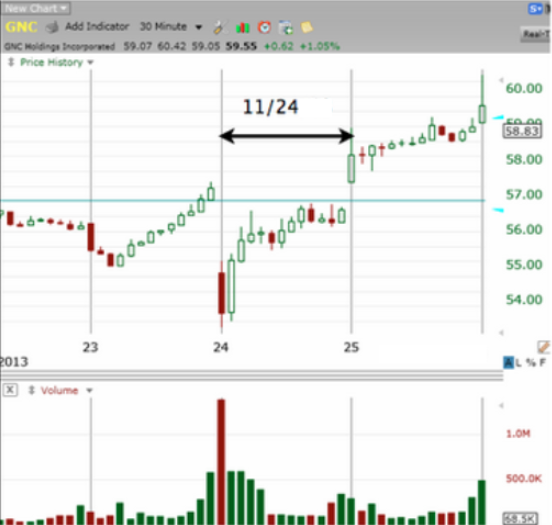
Fig.3 Daily Volume action on GNC price bars.
The day opened on a serious gap-down, which was the greatest volume spike during that half-hour. Sellers were in control unloading large numbers of shares. This usually occurs when retail traders (you and I) sense trouble and begin to sell at the same time. Notice, the three Red days in Fig. 2 preceding the dates in question, prompting the high volume selloff. When enough small traders do this at the same time, as happened in this instance, professional traders storm in to take advantage of the low prices to fatten their portfolios.
This scenario is repeated continually in the market, with volume providing important clues. Volume provides a view from the top of the forest, from the tallest tree, unencumbered by noise from within the forest.
The story is repeated on charts of any time frame, weekly to intraday. The messages volume sends are very important to our trading plans but should not take the place of other indicators that have worked well. It is but one indicator, used as a general warning of a potential change in the market direction.
Notice in Fig. 4, the majority of volume change occurs during the first and the last half-hour of the session. This is generally true across all market vehicles, leading some market players to trade only during morning and afternoon segments of the day.
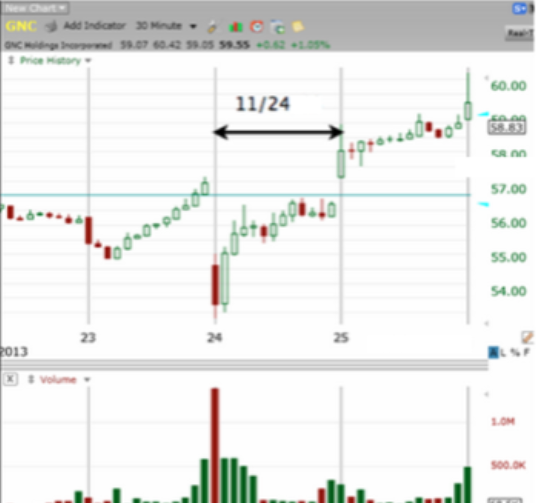
Fig. 4 Daily Volume action on GNC price bars.
Before we leave this post on volume, let's look at a Price/Volume chart, UAM. This illustrates an example of our second general rule for volume:
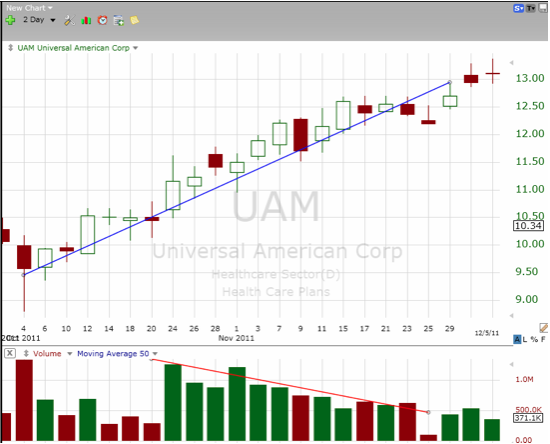
Fig. 5 Healthy uptrend on UAM.
When volume does not follow the price trend, an abnormal case exists. Notice how the powerful divergence shown between price and volume broadcasts a powerful message we must listen to. When prices rise with decreasing volume, the rally is weak and not likely to continue. Or, when price falls in the face of increasing volume, look for a recovery. In other words, whenever volume does not confirm the price action, a red flag should go up.!
Figure 6 shows how price in UAM reacted to the declining volume message:
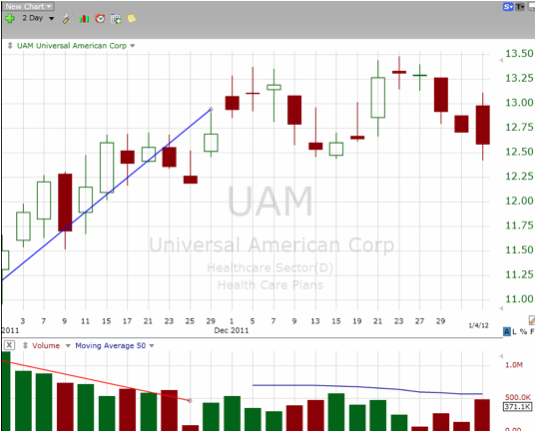
Fig. 6 Resulting price action following volume downtrend.
As the price increased from mid-October through December, there was no confirmation of this action with volume. The rally died without volume support. It tried to rally again but volume still does not provide confirmation. Where to you think the price is headed next?
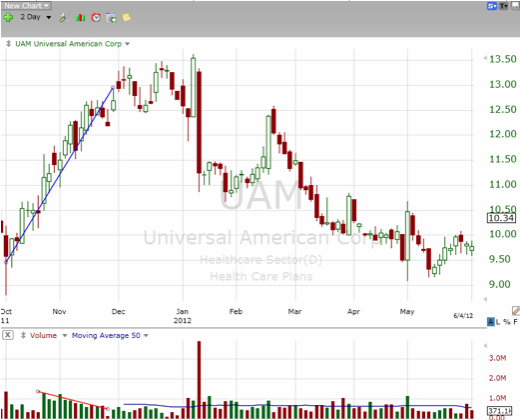
Fig. 7 UAM going forward - You guessed it! Volume helps understand why.
In summary, why do we care about volume? Two big reasons - Confirmation and Liquidity. Volume suggests how traders/investors are feeling about a particular stock. Volume confirms a price trend. If volume is increasing while the price moves up, the uptrend is healthy. A negative divergence is also a confirmation, but on the down-side, suggesting less trader enthusiasm and a potential reversal. Liquidity - a liquid market is a fancy way of saying there are buyers and sellers for that particular security. If I place an order for a “liquid” stock at some particular price, it is likely my order will fill at that price. On the other hand, an order for an ill-liquid issue will likely fill at a price often much different than the original order. Liquidity is very important for traders, understanding why divergent and seemingly nonsensical price actions do occur. An important trade-off occurs when liquidity increases - Noise Decreases.
Now the important caveat(s):
a) Volume did not cause price to do anything.
b) Volume does help us get a sense of what’s likely to happen. And since we’re dealing with probabilities in all market action, improving our odds by sensing the rhythm of the market is an honorable goal!
c) Breakouts and reversals are the meat upon which we feast as traders and every clue suggesting changes in sentiment can provide large dividends. Comparing volume action to price patterns are a rich source of these important clues.
Once a trader achieves harmony between technical rules (... a few touched on in this post) and his/her own self-awareness, can the beauty of speaking and listening to our own inner voice be enjoyed. That is ultimately the only valid source of our success.
Bob Robertson can be contacted at Provident Investing
Last edited by a moderator:
