Some of my trades, forecasts

Status
Not open for further replies.
Re: AUD/USD trade

I am posting this chart to show what an excellent trading opportunity the aussie is presenting. Notice the candle getting under the cloud. Afterwards, it is challenging the cloud to want back in. Of course, the bottom is now resistance, adn so is the kijun, the tenken is pointing downward and will form additional resistance.
Take this setup in lieu of what the weekly chart is telling us, and you have a great journey towards .7827. Price action did run into support on the weekly at .8314 which is the reason for the befunctory.

My chart (FXDD) totally differs from yours
trade.gif
 
Re: AUD/USD trade

What are your settings? Mine are the default--9,26,52.
The posted chart has a bit of a different look, becuase of the different business timeset it has, but it still more closely resembles the one I posted previously.


My chart (FXDD) totally differs from yours
View attachment 86534
 

Attachments

  • audusd short.gif
    audusd short.gif
    20.7 KB · Views: 154
Yellowroses, thank-you. Credit the methodology. After 6 years, I still consider myself in the learning stages. This is a great venue to be in to abet those interests.


This thread is wonderful. There is hardly a thread that posts the quality forecasts that you do. Thanks for your effort.
 
Re: AUD/USD trade

What are your settings? Mine are the default--9,26,52.
The posted chart has a bit of a different look, becuase of the different business timeset it has, but it still more closely resembles the one I posted previously.

I have the same settings.
 
July S&R's

Here's the S&R's for the month of July 2010.
I don't really expect anyone to take my S&R's for real, but the thrill is plotting them on your chart (Albeit your demo.), and then seeing how they react around that point. I haven't begun my official series on the S&R's, but they will put even a further light on them.
I can send you a hard copy of them if you want to e-mail me for them. Again, don't worry. I have nothing to sell, and I'm sure not hard up enough to sell your e-mail to anyone.
Oh yes, the Gold is in here!!
BTW, I just got some new charts that have the 30 main stocks, all the indicies, commodiIties and some other stuff.
The decimnal points I could not apply, because the computer I ahve with me will round off to the 1/100th's adn that is not accurate enough. I'll be home soon.
 
Djia

It tried but unscuccessfully to break into the weekly cloud today, so instead it acted as support. Now, we can expect a move back to at least 10,058 before the DOWN continues.
 
Gold

It made the necessary bounce off my YR1 at 1256.32 to the 38% at 1195.70. The next main stop will be 1220, where some stiff resistance will be met. Gold has been in a strong UP, so it might have the legs to run through it .That level is on the radar before a retreat lower is possible.
 
Cable is on its way to 1.5278. It is right now camping around my MR1. I'd lvoe to see it ignore it and just push the extension to 1.5278. It could tremendous velocity to the run down the hill. I doubt it will happen, because Monday will be a low-volume day. There won't be enough horsepwoer behind the leg to get it there.
 
EUR/AUD--Possible correction

A possible correction could be developing for this pair. The posted chart shows the weekly kijun was hit with ease. Needless to say, this is also resistance This was a powerful move for the pair, and it may need to rest for awhile. The tenken is at 1.4691 and the daily bearish cloud is also 1.4691. This process may need to be needed so the cloud can readjust. A correction lower would indictate the candle would have to find its way back into the cloud. That would complicate things a little. We did have a TK crossover on the daily, but is at 1.4442. What I don't expect is to see another correction with the voracity that was seen in May. A weekly finish above the weekly kijun at 1.4940 is showing us the next leg is also going to have teeth in it. Notice the chinkou that is level with the kijun. Very bullish!
 

Attachments

  • euraud correction.jpg
    euraud correction.jpg
    75.2 KB · Views: 141
Windows 7 compatibility issues

I got Windows 7, and it has some issues. I put typed the monthlies on the spreadsheet, and now they are unreadable. I was going to transfer the yearlies and decades from my flashdrive, and my Windows 7 cannot assimilate the information, for whatever the reason. Next plan is to use another computer and send it from there. Hang in there!
 
Monthlies have arrived!!

This is so insane. I couldn't transfer nothing, but I was able to copy and paste from a spreadsheet, which I wasn't able to do before.
The program only ran decimals points out one place, which does not suffice for this project, so there are none. I'm sure you can use your interpretive skills to put the decimals in the right place.
As far as the yearlies and decades are concerned, well, that's another story. I still might have to figure something else.


R3 R2 R1 S1 S2 S3
EUR/USD 12844 12558 12395 12070 11907 11622
USD/JPY 9300 9092 8965 8712 8586 8378
GBP/USD 15756 15372 15166 14726 14510 14126
USD/CHF 11758 11314 11041 10508 10239 9796
EUR/CHF 14242 13765 13475 12893 12603 12126
AUD/USD 9214 8834 8620 8194 7980 7600
USD/CAD 11210 10846 10639 10225 10018 9654
NZD/USD 7459 7170 7008 6682 6524 6235
EUR/GBP 8600 8410 8298 8074 7962 7772
EUR/JPY 12933 11187 11001 10625 10436 10123
GBP/JPY 13814 13536 13372 13042 12878 12600
CHF/JPY 9044 8504 8197 7583 7276 6736
GBP/CHF 17088 16643 16372 15830 15559 15114
EUR/AUD 15355 14972 14757 14331 14118 13735
EUR/CAD 13627 13328 13186 12836 12670 12375
AUD/JPY 8157 7825 7626 7279 6837 5994
NZD/JPY 6598 6346 6506 5918 5625 5081
CAD/JPY 9019 8701 8504 8113 7925 7603
AUD/NZD 12511 12400 12333 12197 12131 12020
GBP/AUD 18982 18396 18078 17451 17136 16650
GBP/CAD 16871 16397 16138 15619 15360 14877
GBP/NZD 23153 22509 22150 21449 21094 20451
NZD/CAD 7702 7544 7411 7146 7011 6770
NZD/CHF 7985 7711 7546 7210 7039 6769
Gold 1313.42 1279.84 1265.87 1223.18 1203.84 1170.30
DJIA 11605 10226 10540 9530 9301 8698
 
Hello 4xpipcounter,
It looks like lots of job done finding those levels. By the way can you explain how do you draw them.
I've read that you do not use stop losses for your trades. Why is it so? That is because of small lot size comparing to your Margin or this is because to trade ichimoku we should have wide stop losses?
cheers
 
Vladimir, lot os good questions.
First of all, I encourage no one to use my style of trading with regards to stop losses. I break all the rules when it comes to that. I don't like to get spiked out of a trade, such as the types we see when news annoucements hits. I also, with regards to my S&R's and the ichimoku, believe my entries are fully optimized. If when I do get a move in my favor, then figure it out, because of a lack of momentum that the reversal has not officialized, then I jsut take the trade out for a nominal gain. Sometimes, I might let it run when I know the next point is close by, and then double up. This means when the reversal happens, I double my pleasure. Once again, if it has not officialized, then the whole thought process is repeated.
My S&R's are based on a proprietary formula, and has nothing to do with drawing them. The amount of work I do to find them has been minimalized because of the software someone was so kind to give me a few years ago. I plug it in to my platform, and let it to the rest. The software deosn't go any higher than the monthlies, so I do have work to do with regards to the yearlies and decades. In the old chat room, people thought Tucker devised them, because like Tucker, they are my pride and joy.
Trading ichimoku does not mean you should use wide stops. One way that has proven effective (I'll risk sounding double-tounged here, because I don't use stops.) in the past is as an example in an uptrend count 3 candles back, and use that kijun as your stop, adn then graduate it is the trade progresses. Really, that is the optimum determination in using stops with ichimoku. Try to enter a trend trade when the candle has backed into the tenken, and then count 3 candles back and use the kijun as the stop. This can be backtested, because of the nature of the ichimoku, so I encourage you t odo so in order to see the results for yourself.
If it is a strong trend, and it is a counter trade while using my S&R's, then enter at that S or R point, find the TF that is the most OB, and then get out at the kijun. A stop to be used in using my S&R's to countertrend trade with is to plot the fibos on your chart. The way you do that is in the example of entering at R1, plot the fibos from R1--R2, then make a stop for the 38.2% mark. If you are looking for an entry into a strong trend, such as the EUR/AUD, pay attention to the monthlies, wait for a bounce. If it bounce to the 4-hour tenken, and you have determined the trend will continue, then that is where you want to enter.
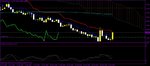
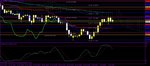
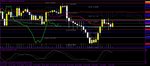
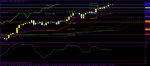
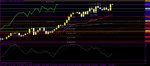
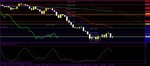
It is just my personal opinion, but there is perfect synergy between my S&R's and the ichimoku. This is because there is nothing lagging about either and there is a harmony. I can give countless examples, but my posted one of the EUR/AUD is a good one. 1.4691 is the week's WS1. That means solid support in that area. It could be broken, but effort is going to be needed. The bears might meet up with more bulls and find they get much more than they bargained for. As always, I don't know what my weeklies will be until the start of the week, because I let the software do it all for me.
Getting back to stops, and my repugnance in its usage. Unless you have an absolute gameplan to back you up, it's suicide not to use them. Also having nerves of steel and your emotional set dipped in ice also helps.


Hello 4xpipcounter,
It looks like lots of job done finding those levels. By the way can you explain how do you draw them.
I've read that you do not use stop losses for your trades. Why is it so? That is because of small lot size comparing to your Margin or this is because to trade ichimoku we should have wide stop losses?
cheers
 
EUR/JPY trade

Here's an excellent shorting opportunity to start the week. That is provided we don't get some obscene spike to start the week.
It is one of those ideal 100-pip setups on the 4-hour chart. The pullback could be brief, so I'd be ready to pull the trigger on the exit quick. Another words, the tenken is 109.39, and the kijun is 109.01. Notice how the tenken has crossed the kijun. It is travelling a distinctive, divergent path. What makes this a nice short trade to start the week is that itis at the bottom of the 4-hour cloud, The cloud is bearish into the future. The MR1 got hit for the first time this month at 110.01. The stochastics are crossed in OB territory.
This will be another good opportunity to see the ichimoku and my S&R's in action at the same time. Also, the cloud gives a really good time element. This trade should take 24 hours or less to complete.
 

Attachments

  • eurjpy s.jpg
    eurjpy s.jpg
    99.5 KB · Views: 140
GBP/CAD trade

This one is tempting to take out early on all those trades I posted earlier last week. The monthly tenken gets hit, but I don't want to take the bumpy road to get there.
This pair is headed for a correction. Notice how strongly divergent the stochastics are. Also, that exact point it is sitting on is my MR1. You can't see the yellow line because the indicator for the current price is covering it up. Yep, I might be reporting +255 to start the week. If I get a strong move against me to start the week, then I'll wade it out. After all, the monthly tenken will be hit.
 

Attachments

  • gbpcad s.jpg
    gbpcad s.jpg
    87.1 KB · Views: 135
GBP/NZD trade

Another one of those stochastic sharp divergent path deals. Keep you eye on this one after it hits the yellow line, which is my MR1 at 1.2155.
 

Attachments

  • gbpnzd s.jpg
    gbpnzd s.jpg
    95.5 KB · Views: 134
NZD/CHF trade

A typical S&R setup with the pair already in a downtrend.
The pair goes back to challenge the MP, and it fails with a semi-doji formation. I blew it in not showing the MS1 at .7212, which is a viable short-term target.
 

Attachments

  • nzdchf s.jpg
    nzdchf s.jpg
    90.4 KB · Views: 143
Status
Not open for further replies.
Top