Some of my trades, forecasts

Status
Not open for further replies.
Soondoock, I caught this on your personal message, so I might as well go Broadway for the benefit of everyone else.

There is a series in there on my S&R's and the ichimoku. You 'll have to dig through the later part of 2007 to find them.
4xpipcounter.blogspot.com

You'll also know who Tucker is when you get there (heh heh).

Thanks 4xpipcounter,
some food for my brain.
 
Re: A statement

Dude, you are trading like ur out of your mind. I got 700 pips on my euraud then u blow me out of the water. I can't keep up.
Hey had a little scuffle in Ga tell u more later. New car running nice. Think i might keep this 1.
Hey Jahdave saw ur post. Herd u can do the deal 2. keep bringing it.


Hey folks, I don't want anyone to think I'm making this up, and don't mistaken me for being cocky. It jsut shows why I beleive in the ichimoku and my S&R's the way I do. Accompanied is my statement. All trades were placed within the last two days, as can be verified, and the trades are up 3,455 pips. 16 are winning and 1 is losing, which was the kiwi I added today.
BTW, this doesn't prove zip about me as a trader. It is only 2 days. I'm not the type that is going to get on here saying you can make 25,792.45% in 5 days of trading. That is hogwash. I will seek to be as transparent as I can be, which is why I will do this occasionally
These trades are also due for some pullback. It's not like thy're going to make a straight line to my targets. I am not living in some sort of dream world.
My largest gain, so far, is the EUR/AUD (check it out) by +532. That could be expected. It has the longest way to go. I'm still holding to 1.7535.
Am I selling anything? Yes! The idea that you can make a few pips trading if you develop a sound methodology.
 
Re: A statement

Zeph, I didn't like you burning scratch in my face, so I said, "I'll fix him!"
Not really! Just making a point how forward-looking the ichimoku is.
BTW, like I mentioned before the pace my trades are going at right now will not continue. Eventually, they'll get off the express and take a drive through the country. That's when it gets testy, because you're spoiled at the beginning.
Now, for the bad news, your trade will also be correcting itself before it makes it to 1.7525.
Actually, you are keeping up. You've made more money on your one trade than I have on all 17 trades combined. I got really low margin. I was only interested in the pips.
Uh oh. I hate to know what happened when you got in a scuffle. Call me at the hotel tonight.
I bet it does. You owe me a ride in it.
JahDave!? No, man. He stinks this joint up. LOL LOL. Not really. He is the one and only Maherajah of the Elliot Wave. We bow when he walks by.
Free plug for your thread, Dave-- EUR/USD Elliot Wave.


Dude, you are trading like ur out of your mind. I got 700 pips on my euraud then u blow me out of the water. I can't keep up.
Hey had a little scuffle in Ga tell u more later. New car running nice. Think i might keep this 1.
Hey Jahdave saw ur post. Herd u can do the deal 2. keep bringing it.
 
Gbp/aud

It will be interesting to see the reaction from this point for this pair. It has been in a ferocious UP, but for the last 6 hours it has been camping around 1.8005 which is my YR1. At this point, I'm not convinced we'll get a bounce, but it will be continuation before any correction ensues. If we do get the bounce, then the expect move is to 1.7409, which is the 38.2% of the distance towards the YP.
 
Eur/usd

Moved my TP down on the EUR/USD to 1.2559. That is my MR2. I don't remember the last time a currency made it to my MR2 on the 1st day of the month. My software plots it automatically. I thought I was seeing things, so I figured it out for myself. Yep, it was right. Anyway, I got enough pips on this, and I don't want to endure a bounce. So, after it hits, it will be +387. This is the point of the bottom of the daily cloud. The indicators are not OB, so we could get a push towards 1.2900. I can't see that far, for now.
 
GBP/USD action today

This is that one hour chart I promised earlier today.
Price hit the MR1 from last month, and then through it for a loop back down the hill. You don't see the line for it, because it was alst month's. The resaon it lacked the follow-through to get back in the DOWN was very predictable. Notice the size of the candles. There was no real conviction. The reason that turning point was predictable is open your ichimoku to the 4-hour chart and the daily. The top of the cloud is in the same place on both time frames. The size of the candles going back up tells the story, as it is saying, "I still like it up here. I think I want to go to 1.5278."
More TF's are coming, but I love my wife more than you guys, so I am getting out of here....for now.
 
Nice Analysis,
Looking also at the EU at the moment, today we have NFP, so trade can be dangerous as for me. But my current view is that price hanging around 1.2500 but both TS/KS are flat so I can move down if price closes under 1.2500 Long term target on Sell can be at 1.2370. Another opportunity I am thinking about is that is price move down fast I expect some retracement and buy position. But need to see how the NFP performs.
Have a nice trades all, do not forget it is Friday.
eu.gif
 
Soondoock, you are right on! That's exactly what I see happening. It will probably be a retracement only, but that should be where it is headed. In addition it just bounced off my MR1 at 1.2559, which is exactly where my TP was at on my former position.


Nice Analysis,
Looking also at the EU at the moment, today we have NFP, so trade can be dangerous as for me. But my current view is that price hanging around 1.2500 but both TS/KS are flat so I can move down if price closes under 1.2500 Long term target on Sell can be at 1.2370. Another opportunity I am thinking about is that is price move down fast I expect some retracement and buy position. But need to see how the NFP performs.
Have a nice trades all, do not forget it is Friday.
View attachment 86506
 
Just noticed something. The candle has found its way inside the daily cloud. We will need a strong move below 1.2500, or a headfake. Other than that, we are headed to the top of the cloud at 1.2900.
Thsi is where things get mixed between the TF's. It is also telling me this UP has some teeth in it. My MR1 at 1.2418 was disrespected, then we have a continuation to the MR2 at .2559, where price meandered under that level for awhile before hitting it, and now we have what we see now. In a strong uptrend, like we see now, it also disrespects OB conditions. One thing is for sure, and mark my word on this one, if we have that move to 1.2900, there will be a strong reversal at that point.
BTW, just for clarification, a "headfake" is where price says (in this case), "I'm in the cloud, so you know I'm headed UP." It stays near the bottom of the cloud for awhile, then falls out.
This is also the reason that I like to confer with all TF's before making a decision to left-click my mouse. Heh heh, if then I don't get it right all the time.


Nice Analysis,
Looking also at the EU at the moment, today we have NFP, so trade can be dangerous as for me. But my current view is that price hanging around 1.2500 but both TS/KS are flat so I can move down if price closes under 1.2500 Long term target on Sell can be at 1.2370. Another opportunity I am thinking about is that is price move down fast I expect some retracement and buy position. But need to see how the NFP performs.
Have a nice trades all, do not forget it is Friday.
View attachment 86506
 
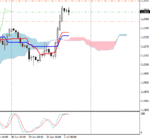
I don't want to sound too opinionated here. But, depended on your trading style determines just how dangerous trading the NFP can be. If you are the type of trader that uses tight stops, then there is no way you want to trade the NFP. If you're like me, and don't care about stops (That's my style, not saying it is right for everyone.), then the NFP can be a snoozer. My LT--MT platform shot up around 600 additional pips during the 1st 10 minutes, and now it has given it all back---zzzz.
News events only create spikes in the markets, but price action is confined to the technical elements. As an example, news can do nothing about the candle for the EUR/USD entering the daily cloud, which, as a rule, and if it closes the day above 1.2400, then price is headed to circa 1.2900.
I've also been following the GBP/AUD of late. The news could do nothing to the pair as it still has been confined around the YP at 1.8005. Draw a hrizontal line at that point, and the last 2 days looks like it has been hanging out the laundry. What GBP/AUD is trying to make a decision on is, "Should I make the minimum bounce to 1.7409, or tease these guys and head to 1.8373.
Just so you know I haven't lost it, I do not sit around all day and talk to the candles.

Nice Analysis,
Looking also at the EU at the moment, today we have NFP, so trade can be dangerous as for me. But my current view is that price hanging around 1.2500 but both TS/KS are flat so I can move down if price closes under 1.2500 Long term target on Sell can be at 1.2370. Another opportunity I am thinking about is that is price move down fast I expect some retracement and buy position. But need to see how the NFP performs.
Have a nice trades all, do not forget it is Friday.
View attachment 86506
 
Good afternoon,
Was out of computer during NFP. Seems that euro gaining strength, but it is also possible that we can see Gap down on Monday morning. Just my thoughts.

Also I have a question, another newbie one. When you trade Ichimoku do you have any limit of pips you earn earn each day, or you just let the pips flow. Because I do not know what to choose. For example I made a trading plan to earn 25 pips per day, 500 pips per month that would be enough for me with my MM. But on the other hand, to earn 25 pips per day can be disrespectful when you use ichimoku, because it is the indicator and system in one.
I hope I will learn more from you trades and explanations 4xpipcounter.
 
I don't want to sound too opinionated here. But, depended on your trading style determines just how dangerous trading the NFP can be. If you are the type of trader that uses tight stops, then there is no way you want to trade the NFP. If you're like me, and don't care about stops (That's my style, not saying it is right for everyone.), then the NFP can be a snoozer. My LT--MT platform shot up around 600 additional pips during the 1st 10 minutes, and now it has given it all back---zzzz.
News events only create spikes in the markets, but price action is confined to the technical elements. As an example, news can do nothing about the candle for the EUR/USD entering the daily cloud, which, as a rule, and if it closes the day above 1.2400, then price is headed to circa 1.2900.
I've also been following the GBP/AUD of late. The news could do nothing to the pair as it still has been confined around the YP at 1.8005. Draw a hrizontal line at that point, and the last 2 days looks like it has been hanging out the laundry. What GBP/AUD is trying to make a decision on is, "Should I make the minimum bounce to 1.7409, or tease these guys and head to 1.8373.
Just so you know I haven't lost it, I do not sit around all day and talk to the candles.


Where are you seeing 600 pips being given back?
On EUR/USD for example, after the big spike up, I've seen about 20 pips being given back.
 
Yearly S&R's coming up

I finished the yearlies last night, and put them on my flashdrive. The only problem I buried the flashdrive in the trunk. Rrrrgh. I'm homeward bound, so tonight, when I get to it, I should be posting them. For now, I'm printing up the monthlies. Also, I am also finished with the decade's S&R's. Our friends from our previous chat room knows what happens when price hits the decade's S&R's. Just look at the price action on many pairs, as well as the DJIA from the latter part of '07, and also check out the action from the mid part of '01. Don't mess with my decade's S&R's.
BTW, last month when we had such a strong plunge from the EUR/CHF that is normally not a very volatile pair is that it took out the deacde's low. It resluted in a 857-point high-low spread. That is huge for this pair.
 
Happy Independnce Day!

Here in the USA, we are going to have fireworks on the 4th. In the global forex world, we are going to have additional fireworks on July 6th. It's going to make the NFP look like chopped liver. It's the nature of the forex world after a major holiday. Check your charts for the day after Thanksgiving (One of my favorites.), Christmas, New Year's, and Independnce Day.
Between now and then, the markets should now be taking a nap, so there is nothing much more to get too excited about until Tuesday--shhh.
 
Go back to post number 161, and you will see the 17 LT--MT trades I have up. Those 17 trades went up a composite circa 600 pips during the NFP report, and then came right back down. Those are the trades that gained me 3,455 pips in two days. Since that posting my EUR/USD closed for +362 pips. I entered it exactly where I close my short, on the daily kijun at 1.2172 (My actual entry was 1.2190.)
I did also mention in another post that pace will not continue for the duration of my trades. There are going to be corrections along the way. The reason I entered so many trades live at one time was just to prove live the effectiveness of the ichimoku.
BTW, during the first 7 minutes, there was actually an open-high spike on the EUR/USD of 58 pips. Ironically, that was the position of mine that closed right before the NFP.
Just the GBP/AUD alone had a 58-pip open-high spike, and I now have 2 positions on it alone, so that represented 116 pips of the spike on aall my positions.

Where are you seeing 600 pips being given back?
On EUR/USD for example, after the big spike up, I've seen about 20 pips being given back.
 
AUD/USD trade

I am posting this chart to show what an excellent trading opportunity the aussie is presenting. Notice the candle getting under the cloud. Afterwards, it is challenging the cloud to want back in. Of course, the bottom is now resistance, adn so is the kijun, the tenken is pointing downward and will form additional resistance.
Take this setup in lieu of what the weekly chart is telling us, and you have a great journey towards .7827. Price action did run into support on the weekly at .8314 which is the reason for the befunctory.
 

Attachments

  • audusd setup.bmp
    1.4 MB · Views: 119
This thread is wonderful. There is hardly a thread that posts the quality forecasts that you do. Thanks for your effort.
 
Status
Not open for further replies.
Top