Journal Take 2 - Chart Patterns

Good Morning Everyone.

Yesterday was Murphy's Law in action. yikes.

GBPAUD - fail.
GBPUSD - fail
EURUSD - fail.

USDCAD long worked. I'm experimenting with some new intraday context filters. Pattern can help in the reward to risk department. And with filters and entry exit rules, a variety of probabilities are possible for practical trading.

I've got strength, trend, timing, so i'm automating long entries on EURUSD. We'll see if Disaster, Inc is still open for business. I lost 4% yesterday, so i'm only willing to hand over 2% max on this long, spread out over 10 separate entries. Stingy. Be Stingy, seriously.
 
Really cautious of the 4hr support line, not expecting much, following my rules in case of a breakdown
 
Now strength and trend bullish... i'm thinking of yesterday.. Going long if this doesn't work out, i'm standing aside folks
 
Never filled on EURUSD long. Crazy in here.. again.. now have no clear bias. standing aside.
 
Had an interesting day. Keeping the journal took back burner. Be back next week with those backtests i mentioned earlier. Need to do some of that this weekend, backtesting.. Have a good weekend.
 
website is having some technical difficulties, will be back up early next week... i'm moving hosting.
 
hey folks. Doing some weekend work.

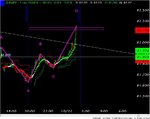
So - with the EURUSD, and EURNZD for that matter, the W patterns, bearish patterns have reacted down as anticipated. In EURUSD price has broken the support trendline from points A & C of a smaller W pattern that occurred within the CD leg of the larger pattern.

Eurosm.jpg

The larger pattern has an almost horizontal A-C Support Line near 1.2850.

Euro2.jpg

The vertical red line shows when the strength meter i use gave a bearish signal using 6hr data.
 
I will be preferring shorts going into next week in EURUSD.

Now, i'd like to share some backtest stats with you all. The tests look at a concept strategy used on the ETF DDM (which tracks the Dow 30). The entries are based on M patterns. The exits are based on targets derived from the pattern dimensions, e.g. 200% of the A-D range T1, 500% of A-D range T2. Money rules include move stop loss to BE once T1 hit, and no more than 2 stop outs per pattern, with 0.5% account at risk per trade. Results are hypothetical backtest
 
Now, my goal in sharing this backtest is to show that through the use of pattern only, and the fractal nature of patterns, Reward to Risk can be skewed favorably

This strategy is CONCEPT, i do not trade real money with it. The win rate is too low, even for me, although the net results are positive.

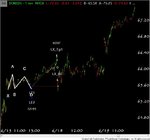
Here is one example of the handful of possible pattern trade outcomes in the strategy, T1 hit, BE on rest:

SimpleExample.jpg

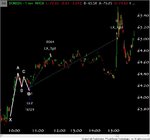
Here is another T1 and T2 hit:

SimpleExample2.jpg

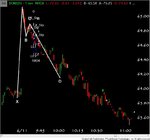
Here is a failure:

SimpleExample3.jpg


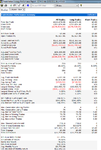
Now the strategy is Long only over 1 year of DDM data with $8 RT commissions paid.

Here's the report:

StratPlain.png


This test uses 100k account size.
 
You can see win rate is very low. However Reward to Risk is very high. It HAS to be to be net profitable with 10% accuracy. So the trick becomes to find a high probability context into which pattern Reward to Risk parameters can be utilized. Then, well, things look very good.
 
Also important to note, the largest losing trade was WAY beyond 0.5% account risked. Why?

Gaps. that trade was from November 9th, 2011, Long & holding over night, exited at open next day. That is one reason why i day trade, especially stocks.
 
Can you imagine still trading a strategy after 74 consecutive losing trades?? I can't do it, thus why i don't trade this particular strategy. You need context filters. This backtest is just over one year of DDM 1m data, doesn't use any filters (moving averages or anything) - its solely pattern based entries and exits and money management.
 
AUDJPY also in position for a possible short. Strength meter is just turning bearish AUD and strong JPY using 6hr data.

audjpy.jpg
 
Here a a couple of Central Bank action related trade setups (?)

What do you guys think?

USD vs Hong Kong -- In this one, i read in Reuters that the Hong Kong Monetary authority is supposed to keep the rate between 7.75 and 7.85. So, a move back up to 7.8 seems likely here. I'll be watching for a long on this one soon.

hongkong.jpg

EURCHF -- Swiss National Bank claims to want the rate at 1.20. They said the same at 1.50, right? Well, from the spike low that happened near 1.50 to the ultimate continuation the time that passed then is equal to the time that has passed since the current August 12th spike low. So if time is in symmetry, we could get new lows starting soon.

EURCHF.jpg
 
Also, if anyone wants me to run that same strategy on a different market, just let me know. As always, comments, questions, or concerns are welcome
 
Well AUDJPY isn't rolling over easily. Surprising me. EURUSD so far has been an equal opportunity market on long and short sides so far this week.

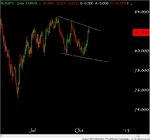
AUDJPY is practically at the Daily R TL now.. I suppose it could be a flag breakout if it gets much higher above 83.05. The 6hr strength tool weighed heavy in my expectation for a short trade - it still reads bearish AUD bullish JPY, a short setup. Price could reverse from current levels. We'll see what happens.
 
Top