TonyIommich
Member
- Messages
- 79
- Likes
- 21
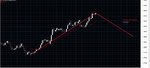
Here's 5 minute SPY today (I did not trade today, I am just marking the chart). Three possible setups a la Volman.
A. An aggressive box break, which ends up failing. Market gaps up and has some strong bullish action throughout the morning, despite the higher time frame trend lower. There is a level a bit higher (the unfilled down gap from three days ago) that the market was aiming for but failed to test. Note the breakout happened at around 11:30 which is often when the market likes to resolve unsettled business during the open - either by a with-trend push or a counter-trend push.
B. The lunch doldrums, as Volman likes to call them, did offer a pattern break combi setup here. However, we were stuck in a sideways winding range for a while. Btw, little research note: if you have had a non-volatile morning, especially when candles have wicks on both ends, stay the heck out of lunch unless you get A++ buildup along with trend confluence.
C. If we didn't get long, or if we scratched out of our earlier trade, this false bottom was a beautiful invitation to get involved. The buildup was amazing, and the follow through was great. 3:00 PM often provides some strong moves.