barjon
Legendary member
- Messages
- 10,752
- Likes
- 1,863
Thought I’d do the next one as a new thread since the first one got a bit derailed .
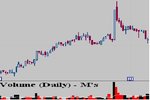
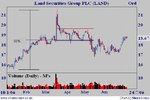
With a different slant, this one again centres on the price action after a high volume, long candle event (promise something entirely different next time :cheesy: ). As I said before, these events are often followed by a move (open to close) in the opposite direction the next day. Traders planning for that would likely have gone short as the price fell back through the open the next day, if not before. Anyway, that’s all a bit bye the bye.
In this one the price had been steadily rising for some time and every high you can see on the way up was an all time high. After the hvlc event the price tried for more but fell back. It continued to fall day by day until we arrive at the cut off point where a hammer type near doji prints at the base of the long candle.
So wot happened next? And, more importantly, what trade might you be anticipating, with what entry, with what target in mind and with what stop?
Over to you - full chart comes Tuesday evening.
good trading
jon