Hi frugi,
Sorry to know you did not have a good day. I thought the moves were pretty clear both yesterday and today, especially in ES.
Hi cly,
Thanks. It was my own fault for taking an entry that didn't exactly meet my qualifications (as well as being awful at reading the market!). Still, a small loss is a happy loss when it remembers how big some of its ancestors were.
🙂
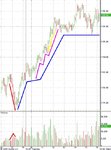
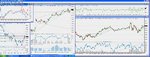
As for the moves, I like the 5 wave patterns you mark, a single wave of one encapsulating another smaller set very neatly. Is this an example of what you mean by "clean" formations and thus perhaps more predictable? I imagine that for the moves to be clear that there are a number of factors involved, but the rather symmetrical appearance of the bars as they relate in the trend may be one of them?
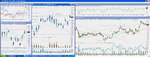
[Off topic - I also remember something Skim pointed out with regard to the volume. As the trend goes up on your chart there are a number of high volume up bars, with the volume generally increasing as the trend unfolds. If you were worried that any of these bars might represent a reversal (as eventually happens a little while after the highest volume bar) all you had to do was wait. If the price went up after one of these bars then you know it is the big boys throwing fuel on the fire, not quenching the trend. How do know this? Cause it's going up! So you can join them in the trend. This is only just making sense to me now, simple though the concept is, it always sounded like hindsight, yet it isn't. Though I may have misinterpreted her somewhat.]
About yesterday. I was watching ES. In the afternoon time I mentioned, from 14:45 to 15:20 there was a controlled down move just ending at the intrday low and the top of the gap, as highlighted by the red line. There were no more sells, and the price began to go up. After that, the moves were pretty clear, as indicated by the lines of different colours.
What makes the move controlled and would would the opposite be? Panic selling, ragged patterns, not instigated by the big boys perhaps? Can you tell who is engineering the move and their intent just by looking at the bar patterns?
Forgive me some amateur "curve fitting": The volume pattern you mark shows decreasing selling pressure followed by quite a bullish bar on higher volume to mark the bottom. There was then a higher high on less volume, showing that the path of least resistance was up, the a pullback bar, then a bar that pierced the higher high set two bars previously, thus confirming the bottom. This bar was almost a bozu as the crowd realised the bottom was in. (???)
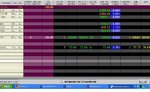
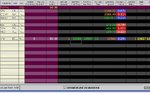
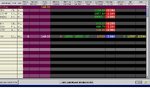
I got the hint about the big boys from the market depth information. I did not watch YM, but I suspect there was similar information there. This information is proving quite helpful to me, but I would advise to check whether such information can be integrated into your own methods before adopting it, because it can take a bit getting use to, and it could lead to information overload if misused.
Thank you for mentioning this. Do you mean market depth as in bids & offers posted at various levels around the current bid/offer, with size shown? I imagine to decipher the information is not simple, but might you be looking for certain things such as a lot of size coming into the market on one side, an imbalance between the size on each side, pulling and posting of bids & offers designed to trick etc.? I'm probably way off the mark because I've never looked at market depth. As you say I do not wish for information overload, but if something is useful and I can train myself to understand and incorporate it then I will make every effort to do so. Do you watch T&S as well?
Sorry, what a ridiculous number of questions I've asked! Please don't answer a single one if you don't want to, I know how annoying the third degree can be.
😀
I will try to post when appropriate, but as I have mentioned, I am aware that my methods are not always in sync with the thread. Just let me know when to shut up.
No please do not shut up!
😆 You obviously know your stuff and, without wishing to sound ridiculously selfish, I am very interested in hearing about your methods in as much depth as you are willing to provide.
🙂 It is very generous of you to take the trouble and I am of course very grateful for any advice offered, though sorry I can offer little in return as I am behind you on the trading path, but eager to keep climbing. (This applies to others who add more than the occasional gem too).
And really glad to see some p/v experts have resume posting again.
Yes, the more of them the better
🙂 The sooner I can rid myself of indicators the better! (no offence anyone).
Anyway I've wittered on long enough. I've got a date with market depth tomorrow
🙂
Have a good evening clylbw.