You are using an out of date browser. It may not display this or other websites correctly.
You should upgrade or use an alternative browser.
You should upgrade or use an alternative browser.
frugi said:Just thought I'd start keeping an average points per day from here...
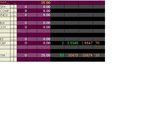
19 days on which I traded
332 points
17.47 points per day
EXCLUDING COMMISSION (I have a spreadsheet with all the relevant info on but it contains other trades so I cannot simply import it)
This data is MOST useful. It is the single most important statistic that "wannabe" traders would like to know. TT does the same thing on the Dow thread, as you have probably seen. It has to be the most realistic yardstick that any one will see.You could deduct the commissions( as points), as we don't know the total number of trades in your 19 days . Could be 19, could be 190.......
clylbw
Well-known member
- Messages
- 454
- Likes
- 4
frugi said:Thanks clylbw, you reminded me to look more closely at the 5 min chart...Please feel free to elaborate as you see fit - I can keep a secret :cheesy:
What a quasi-witching day we have had today :cheesy: .
Anyway, you are very welcome, frugi. It is just that I am aware my subjective methods based on p/v and a longer time framework may be a bit out of sync in this thread, which I assume is based on objective methods. Please do let me know if I am muddying the water, and I will shut up for good 🙂 .
frugi
1
- Messages
- 1,843
- Likes
- 133
Rise and shine all you gold-diggin' mothers...
....are you too good to tangle with the po' po' boy?
Sorry, forgive the Kings of Leon quote.
On the one hand I'm making a paltry 15 odd points a day after costs. Little to be proud of, especially after only 19 days - a pathetic statistical sample, to say the least.
On t'other, I'm cautiously trading a £3k account and making > 1% ROC a day.
Hmm...
Double my contracts, keep the discipline and suddenly I'm earning a modest living from intraday Dow. If only it was so easy!
Price action rulz - clylbw knows it; I'm working on it 🙂
Last edited:
roguetrader
Senior member
- Messages
- 2,062
- Likes
- 49
15 points a day is pretty cool if you are trading enough contracts to meet ur needs
temptrader
Well-known member
- Messages
- 393
- Likes
- 55
frugal,
This is one of the best threads on this site!
This is one of the best threads on this site!
frugi
1
- Messages
- 1,843
- Likes
- 133
Lack of setup upsets
Grazie for the complimenti 🙂
Little for me today. +5 from one.
A tweezer bottom with accompanying vol climax on the 5 min around 17:10 after 5 waves down indicated a long at 678 but after a run up of 20 odd points I was eventually stopped out by my 5 point lock-in Ifor Williams trailer at 683.
A convincing vol climax around 19:00 would have made for another tempting long entry, though there was no ND to confirm and as 64 INDU went I would have expected 650. As it happened I was dispensing offal to the kitties at the time so no matter.
My MyTrack data is a bit messed up today so sorry for lack of chart.
Attachments
clylbw
Well-known member
- Messages
- 454
- Likes
- 4
Hi frugi,
Do not know about your setups, but the 5-wave fall before 12:00 EST looks tradable to me. But I suppose the most important thing is that you have followed your plan. And, thanks really to the help of a p/v expert, the 12:00 and 14:00 EST tweezer look a bit weak in the low-volume context, without climatic volume supporting either of them.
Anyway, I am going away for the holiday. See you all later and wish you happy trading in the new year!!! 😉
frugi
1
- Messages
- 1,843
- Likes
- 133
In my defence the volume at these points looked reasonably climactic on the 1 min, at least compared to previous bars, but perhaps not sufficiently savage to warrant a trade, as you say. As ever I concede to the experts!
Anyway Happy Xmas clylbw, and don't you dare stop posting when you return 🙂
Anyway Happy Xmas clylbw, and don't you dare stop posting when you return 🙂
Money_magnet1
Junior member
- Messages
- 31
- Likes
- 1
Frugi hi,
Don't have enough hours in my day at the moment so to save me reading the whole thread could you give me an approximation of your average daily scalp ?
Don't have enough hours in my day at the moment so to save me reading the whole thread could you give me an approximation of your average daily scalp ?
Money_magnet1
Junior member
- Messages
- 31
- Likes
- 1
Frugi, apologies, looking back at the above post it didn't come across quite as I intended. It looks a bit abrupt but wasn't meant to be and there was no hidden intent either. In fact even the question was not really the one I needed to ask. 😱
What I'm really looking for is some guidance on what is a reasonable realistic daily target, as a novice to this style of trading (scalping) and how many ticks per trade should I be targeting ? I understand it's probably a very subjective thing but any advice would be much appreciated.
Others feel free to join in !
frugi
1
- Messages
- 1,843
- Likes
- 133
No worries money_magnet no offence taken.
Personally speaking, I think 15 points a day is realistic (my principal goal for now is to achieve this consistently trading two contracts) and I am looking for at least 10 points per winning trade, ideally more. Stop losses are around 8-15 points, usually.
I actually don't think of myself as a scalper, although a glance at my results probably gives the impression that I am, as I am sadly awful at following trends! Neither am I a 'one trade a day with wide stop' person, mind you 🙂 One day perhaps, but for the moment I am happy simply to grab a few points when the market lets me have them; every winning day is a significant victory and that is enough for now.
Money_magnet1
Junior member
- Messages
- 31
- Likes
- 1
Frugi,
I did think you were a scalper in the truest sense (now Chrimbo is out of the way I can slow down a bit and actually read the posts properly !) but it doesn't matter, any info on short-term trading (targets, stops, etc.) is informative and much appreciated. Scalping is my way of minimising risk but I'll be using a trailing stop at certain times so if the set-up looks good enough I'll try and stick around for + pnts ? Who knows.
Cheers m8.
frugi
1
- Messages
- 1,843
- Likes
- 133
Am I trading Forex again?
There are days when scalping (I kinda like the word now so I think I'll adopt it 🙂) just doesn't compare to trend following and this was one of them. In fact the last two days looked absolutely perfect for the sell x breakout 'n' cover near the close posse.
Still, not a disgraceful start to the New Year with +44 from two. There was a time when a day like this would have killed me as I have a long running irksome penchant for thrusting my paw in the way of falling swords, but not this time, thank Douglas. "The Disciplined Trader" is brilliant imho and I recommend it for anyone who wants to be "supercooled" while they trade, avoiding "forced awareness" even when the price action is as hot and confusing as Daphne's shed in summer. I need to digest his prose six more times, of course; nevertheless I have not been affected by a few simple concepts in this way for a long time (jaded old Clanger!) 20% method 80% in your own head. It's true you know. Well, you did, but it takes us pink wooly creatures longer than average to work these simple concepts out. 🙂
A sextet of possibly interesting observations (probably wrong: remember, I am a relative amateur compared to many on t2w, despite Roberto's kind accusation of my being 'gifted' lol I wish, I'm just trying to survive) for me today. Any glaring errors corrected by those in the know will be very gratefully received.
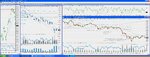
1. If a gap is filled and the price continues in the same direction then a prolonged trend in the same direction, often to the close, is likely. Thanks sandpiper.
2. A nice 5 waves down through the day, although the 5th wave went a bit crazy after Greenspan warned of irrationality of some sort (that'll be his, then. Lol. Still if he helps my comp entry who am I to complain... :cheesy: )
3. During the first hour or two there was divergence among leading indices. e.g the BIX was up while the SOX was down. Naz was down heavily, Dow was very resilient. So I was looking for reversals at S/R, not a trend day. This helped my first trade of the failed triple top around 15:15. But at 6.30 the BIX fell into the red at last and the Dow promptly accelerated to catch up with it's friends. This said watch out it might become an ugly trend day, which it obediently did.
4. The 3 point stepped bottom (or 5 waves down on the 1 min, like, whatever) between 19:05 and 19:50 was picture perfect. It also came dressed in alluring positive divergence from the houses of TICK and RSI. But look how an early entry on the little divergences could have mashed my account. I was VERY tempted to enter at 640 around 19:38 but in a brutal downtrend with no obvious support points wait and see was the answer. No need to hurry. Do I want to rush in? No! Voila, as China would probably say, the 3rd visually 'obvious' geometrically related by degree (?a320 🙂) peak presented itself at 19:50. No I didn't take it cause I wanted to protect my 44 points (erroneous thinking I know, but it was the first time I'd traded for 2 weeks and I was nervous) but it proved to be a good place to enter.
5. The 100 EMA is a very useful line in the sand on trend days. Chartman pointed this out er, let me see, about four years ago 😀 yet still I fail to give it the respect it deserves. 'Always watch price in relation to something else'. See the darksiders recoil!
6. Interesting how TICK has vacillated between +/- 500 over the last two down days. In an uptrend it seems to vacillate between 0 and 1000. On a range day, perhaps -200 to +700, dunno about this, got to look at itmore closely. Either way TICK is an undervalued indicator imho.
Enough of my rambling anyway. Cheers folks.
There are days when scalping (I kinda like the word now so I think I'll adopt it 🙂) just doesn't compare to trend following and this was one of them. In fact the last two days looked absolutely perfect for the sell x breakout 'n' cover near the close posse.
Still, not a disgraceful start to the New Year with +44 from two. There was a time when a day like this would have killed me as I have a long running irksome penchant for thrusting my paw in the way of falling swords, but not this time, thank Douglas. "The Disciplined Trader" is brilliant imho and I recommend it for anyone who wants to be "supercooled" while they trade, avoiding "forced awareness" even when the price action is as hot and confusing as Daphne's shed in summer. I need to digest his prose six more times, of course; nevertheless I have not been affected by a few simple concepts in this way for a long time (jaded old Clanger!) 20% method 80% in your own head. It's true you know. Well, you did, but it takes us pink wooly creatures longer than average to work these simple concepts out. 🙂
A sextet of possibly interesting observations (probably wrong: remember, I am a relative amateur compared to many on t2w, despite Roberto's kind accusation of my being 'gifted' lol I wish, I'm just trying to survive) for me today. Any glaring errors corrected by those in the know will be very gratefully received.
1. If a gap is filled and the price continues in the same direction then a prolonged trend in the same direction, often to the close, is likely. Thanks sandpiper.
2. A nice 5 waves down through the day, although the 5th wave went a bit crazy after Greenspan warned of irrationality of some sort (that'll be his, then. Lol. Still if he helps my comp entry who am I to complain... :cheesy: )
3. During the first hour or two there was divergence among leading indices. e.g the BIX was up while the SOX was down. Naz was down heavily, Dow was very resilient. So I was looking for reversals at S/R, not a trend day. This helped my first trade of the failed triple top around 15:15. But at 6.30 the BIX fell into the red at last and the Dow promptly accelerated to catch up with it's friends. This said watch out it might become an ugly trend day, which it obediently did.
4. The 3 point stepped bottom (or 5 waves down on the 1 min, like, whatever) between 19:05 and 19:50 was picture perfect. It also came dressed in alluring positive divergence from the houses of TICK and RSI. But look how an early entry on the little divergences could have mashed my account. I was VERY tempted to enter at 640 around 19:38 but in a brutal downtrend with no obvious support points wait and see was the answer. No need to hurry. Do I want to rush in? No! Voila, as China would probably say, the 3rd visually 'obvious' geometrically related by degree (?a320 🙂) peak presented itself at 19:50. No I didn't take it cause I wanted to protect my 44 points (erroneous thinking I know, but it was the first time I'd traded for 2 weeks and I was nervous) but it proved to be a good place to enter.
5. The 100 EMA is a very useful line in the sand on trend days. Chartman pointed this out er, let me see, about four years ago 😀 yet still I fail to give it the respect it deserves. 'Always watch price in relation to something else'. See the darksiders recoil!
6. Interesting how TICK has vacillated between +/- 500 over the last two down days. In an uptrend it seems to vacillate between 0 and 1000. On a range day, perhaps -200 to +700, dunno about this, got to look at itmore closely. Either way TICK is an undervalued indicator imho.
Enough of my rambling anyway. Cheers folks.
Attachments
Last edited:
It's allowed, I'm sure ... I've been trading the Dow for the last 3 days so it must be! Thanks for another helpful and interesting post. And welcome back, by the way.frugi said:Am I trading Forex again?
Last edited:
frugi
1
- Messages
- 1,843
- Likes
- 133
Home on the range
Cheers Roberto!
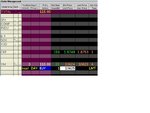
First of all back to TICK, my very rough (stwike him wery wuffly centuwion!) observations as ever. Uptrends 0 to 1000, down trends +/-500, ranges anything goes but often anything from +/-500 to +/-1000. The point is a pattern will often become clear as the day progresses, though that doesn't mean the pattern will hold all day.
On range days you can fade the extremes. e.g today till about 17:30 fading the +/- 500 points would have been useful, but then there was an expansion that encompassed +/-1000 which might have signified a changing dynamic, or something equally meaningless.
After two strong trend days a range was likely.
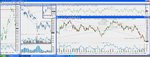
+23 from two quite risky scalps. First trade S 775 not shown on chart. No decent ND/PD or Grail setups so I grabbed what I could mainly using volume and candle patterns. The magic numbers 32 and 64 also provided useful reference points through the day. Why this happens I've no idea, self fulfilling prophecy perhaps. The world must read Chartman 🙂
There's an M pattern formed on the 5 min and futures have dropped below 600...more down tomorrow perhaps. That might set up a nice PD on the 60 min chart, who knows?
Incidentally switching to a line chart on the 60 min has helped clarify my longer term perspective. Just looking at the close as opposed to OHLC filters out a lot of noise and often shows consolidations especially in a new light (no spikes). e.g look at the descending triangle between 800-860 from a few days ago. The equivalent bar chart gave little clue (to me at least lol) that this would break down, but the line pattern did. Using closes shows simply who won each battle without having to see which bits of the battlefield were visited, if you like!
Cheers Roberto!
First of all back to TICK, my very rough (stwike him wery wuffly centuwion!) observations as ever. Uptrends 0 to 1000, down trends +/-500, ranges anything goes but often anything from +/-500 to +/-1000. The point is a pattern will often become clear as the day progresses, though that doesn't mean the pattern will hold all day.
On range days you can fade the extremes. e.g today till about 17:30 fading the +/- 500 points would have been useful, but then there was an expansion that encompassed +/-1000 which might have signified a changing dynamic, or something equally meaningless.
After two strong trend days a range was likely.
+23 from two quite risky scalps. First trade S 775 not shown on chart. No decent ND/PD or Grail setups so I grabbed what I could mainly using volume and candle patterns. The magic numbers 32 and 64 also provided useful reference points through the day. Why this happens I've no idea, self fulfilling prophecy perhaps. The world must read Chartman 🙂
There's an M pattern formed on the 5 min and futures have dropped below 600...more down tomorrow perhaps. That might set up a nice PD on the 60 min chart, who knows?
Incidentally switching to a line chart on the 60 min has helped clarify my longer term perspective. Just looking at the close as opposed to OHLC filters out a lot of noise and often shows consolidations especially in a new light (no spikes). e.g look at the descending triangle between 800-860 from a few days ago. The equivalent bar chart gave little clue (to me at least lol) that this would break down, but the line pattern did. Using closes shows simply who won each battle without having to see which bits of the battlefield were visited, if you like!
Attachments
roguetrader
Senior member
- Messages
- 2,062
- Likes
- 49
It is my understanding that Tick values in excess of +/- 1000 show buy and sell programs, used to follow Tick religiously but found it too erratic, I would imagine it to be a useful scalping tool but not much else imho
roguetrader said:It is my understanding that Tick values in excess of +/- 1000 show buy and sell programs, used to follow Tick religiously but found it too erratic, I would imagine it to be a useful scalping tool but not much else imho
Take note, saying tick >< 1000 is a sell/buy is just a general guideline.It's no different to all the other indicators, ie RSI OS at 20 OB at 80. On some days, this can be 30 /70, on others 10/90.
That's what they don't tell you in books. I think this is why divergences work so well- they reflect the 'current' sentiment rather than any absolute value.
Nice work Frugi.
Similar threads
- Replies
- 21
- Views
- 9K