Yeah, but why though....?

wasp

Legendary member
Messages
5,107
Likes
880
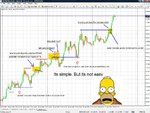
At a bit of a loose end waiting on a call so to pass the time........

Double tops
Double bottoms
Higher Low
Lower High

As we can see, on the chart, pretty good indications, in any TF, of whats going on, where trends are ending etc etc...

Why is it though? Pretty darn obvious and too easy surely? Who causes it to be so perfect? I mean, for all the talk of big boys trying to skew n00b's into the opposing direction, why make it so obvious...?

DT/DB's are pretty obvious levels for buyers/sellers to step in, I guess the HrL/LrH scenario is to reverse it short of those with orders at the prior high/low areas, so it reverses without it hitting....

Just pondering whilst killing time... anyone any thoughts....?
 

Attachments

  • ex.gif
    ex.gif
    38.6 KB · Views: 422
Becasue a lot more of the Business going through the market is proper orders not just brokers trying to screw "the little people"

If you have a seller of 10m (or whatever) at X then they will probably dribble it out at a few ticks above/ below in lots of say 10000, if there is an appetite then they will trade up to there a few times but not break, when the order is finished the buying carries on.

The pullback from X price will be other sellers and speculators as the price has failed to break X selling it down before the buying outweighs this and takes price back up to X.

Why does it sometimes break X and then pop back?

The large seller has finished and reported back 10m done, client says OK sell another 5m at X so price is pushed back down to X
 
Last edited:
but it isnt obvious, is it?

the point at which you draw the line must be at least 1-2 bars after the event has taken place, surely?
the price has to move some distance away before you accept it is a genuine trend-change.

unless you drew the lines tentatively, and anticipated a change. which, later on manifested itself.
under those conditions, some trades would have failed.
then, the factor, or how far against you are you allowed to let price go against you before deciding to stop-and-reverse.

the other thing is the line you draw indicating HrH DTs etc are not necessarily the points you enter at.

this perceived simplicity does my head in.
 
No question per se Hotch, more a thread for discussing why price does what it does and where and when and musings along that road to put context behind 'labels' for newbies, much like foredogs great reply....

The how to draw a line is easy Trendie, its the context that makes it come together.. .the why it/they did it...
 
Well, that's how the market works. I don't think it can't be any other way.
 
Well, that's how the market works. I don't think it can't be any other way.

Yes, agreed, but this thread is here in the first steps for newbies to not just look at a chart and say > that line = double bottom thus it should go up... put some context behind why 'double bottom' or 'higher low' so it makes sense....

Who caused it?
Why did they cause it?
Why not double bottom?
Why not Higher low?
Was that drop lower stop hunting or exploring to see if more downside?
 
Do you never think...

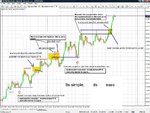
Double bottom possibility here... Whats really going on?

or, is it just...

Double bottom possibility here... ker-ching!


Maybe I'm on the wrong website?
 
D'oh.

EDIT: wasp, you are on the right website. I am merely putting an alternative viewpoint. You wouldnt want everyone agreeing with you now, would you? that would be boring.

EDIT2: just as an aside, I have started to notice price bouncing of previous ranges that its broken out of. I still need a indicator to trigger me in though.
 

Attachments

  • may-doh.jpg
    may-doh.jpg
    235.1 KB · Views: 358
Last edited:
Misread the intent of the question. Didn't pay much attention to the forum :p.

Thought you were asking why "big players" didn't somehow manipulate the market to make monnies and make it impossible to us "little" guys to make money.
 
Don't want people to agree at all, want arguments, want disagreements, want discussion about why....!

Alt view on your chart but the factors are still the same.... Stop thinking so much about how to profit, and view the chart from a neutral POV and try to guage what is going on, who is doing what and why and where and what it why it happened and how did it happen, and why is it so obvious? Why not suck in more the opposite way? Did they do it on purpose?

the more context behind something,the more sense it makes IMO, hence the initial thread topic....
 

Attachments

  • may-doh.jpg
    may-doh.jpg
    232.7 KB · Views: 297
In part, yes....

DT/DB or HrL etc are so blatantly obvious... how come? too easy surely?


Misread the intent of the question. Didn't pay much attention to the forum :p.

Thought you were asking why "big players" didn't somehow manipulate the market to make monnies and make it impossible to us "little" guys to make money.
 
I always thought a double bottom/top would be when say company/bank x has been holding on to a position for a long while and then they let go when the market reaches their target or some sort of level they see as dangerous then it takes off or doesnt when they re-enter depending on how they foresee the future of that market.

TBH I think the bigger the business the less attention they pay to people like us. With the tools at their disposal, internationals can make ridiculous sums with nothing more than in-house procedures.
 
Last edited:
I always thought a double bottom/top would be when say company/bank x has been holding on to a position for a long while and then they let go when the market reaches their target or some sort of level they see as dangerous then it takes off or doesnt when they re-enter depending on how they foresee the future of that market.

In simplest terms, yes, that is just it. But things are never that simple... are they?
 
Well, I think what lots of people forget, is the market isn't just traders speculating like us. Some people...you know...actually want this stuff.

It's basic macro economics. Company in Britain wants to buy cars from Japanese company. Japanese company sells it's cars in JPY, so British company has to convert it's GBP to JPY -> demand for GBP goes down and demand for JPY goes up -> GBP/JPY goes down.

I would guess (always been my opinion at least), that companies actually wanting the currency, as opposed to speculating, does the bulk of the moving, and all we want to do is ride the effects of this.

To conclude, the market doesn't move because of a double top, but that a double top is the sign created by other factors which we can follow.
 
At a bit of a loose end waiting on a call so to pass the time........

Double tops
Double bottoms
Higher Low
Lower High

As we can see, on the chart, pretty good indications, in any TF, of whats going on, where trends are ending etc etc...

Why is it though? Pretty darn obvious and too easy surely? Who causes it to be so perfect?

I'm way out of my league here, but with the aim of a decent discussion at the risk of looking clueless, a few points...

1. DT/DBs, I can see lots of occasions on your chart when these were a useless signal. The trouble is you have to look much harder to see these events than to see the times they 'worked', the DT/DB is self-fulfilling.

2. DT/DBs again, 'anchoring' in its purest form?

3. It is impossible to separate cause & effect. Fib levels are clearly nonsense (don't start!) but as long as enough participants believe in them they magically appear, the same with the features you mention here.

Ben
 
Thats what I've said hotch. Piggybacking with our few quid that has no influence on the market has to be the best way to make money. Our involvement in the market is like spitting in the rain.
 
Ok...here comes the sexy metapwhoar...

The big money, is Godzilla, and we're loud mouth New York taxi drivers. All we do is follow the big ****ing lizard.

IT'S NOT HARD.

What is hard, is for aforementioned lizard, to skulk off to new jersey without us noticing what he's up to by the giant footprints (T.A.)

Fin
 
Do you never think...

Double bottom possibility here... Whats really going on?

or, is it just...

Double bottom possibility here... ker-ching!


Maybe I'm on the wrong website?

What's really going on? You have just spotted a DB, along with a million other people, and so everyone piles in. :D

So many watch TA these days that they make these patterns happen.

Suggestion: The first bottom minus x points makes the stop and as so many people believe that these patterns are gospel, they buy in for the bounce.

This is all mass dealing. There is no other way to trade, except watch for some point on the chart and draw a stop position some distance away from it.

Besides, you have had a journal, just think of all the followers you have had .:)

Split

From what I've seen in the big banks, their traders don't use T.A. However this may just be because they don't need charts, and still acknowledge double tops just be "remembering" where it's been etc. Dunno. Not that your point isn't valid, just something intriguing.
 
Rofl hotch, love the sig:

"Hotch: Showing that Chatzy's /flipcoin function is a better trader then you since March 09"

put linkage on it.
 
Top