blackcab
Established member
- Messages
- 523
- Likes
- 51
Chartman and others talk about xxx32 and xxx64 being significant numbers on YM, eg 10532. I tested this on some 2003 data and didn't find anything unusual about those numbers, but did find something else odd. Maybe I made a mistake, but I can't see it.
I counted the no. of times each least significant digit pair (00, 01 ... 99) occured over the high and low prices for each bar (57,046 bars in total). I ignored open/close as H/L must be more relevant for 1-minute bars.
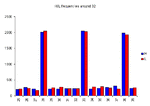
The first graph shows the frequency of all the pairs from 00 to 99. What would you expect to see? Fairly flat, maybe with the main round numbers like 00 and 50 occuring a bit more frequently and, if the theory's correct, 32 and 64 being more frequent? But it's nothing like that - the distribution is - well - odd. Each fifth pair (03, 08, 13, 18, 23 ...) occurs much more frequently. Can anyone explain it?
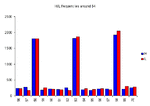
The 2nd and 3rd graphs zoom in to show the frequency of 32 and 64 compared with their neighbours, and there's no difference. that must mean 32/64 are not special after all, i.e. they account for no more bar highs/lows than any other number.
The data I used was YM 1-minute bars from 2.1.03 to 24.7.03, between 8:21 and 15:59 Chicago time - 57,046 bars in total. The price range over the period was 7418-9342. Method in Excel: for each bar's H & L: a=TEXT(price,0); b=RIGHT(a,2); c=VALUE(b); count frequencies of 0-99 inclusive in c.


