Wyckoff Method, The: In The Original

Status
Not open for further replies.

dbphoenix

Guest Author
Messages
6,954
Likes
1,266
The tape is like a moving picture film. Every minute of the day it is demonstrating whether supply or demand is the greater. Prices are constantly showing strength or weakness: strength when buyers predominate and weakness when the offerings overpower the buyers. All the various phases from dullness to activity; from strength to weakness; from depression to boom, and from the top of the market down to the bottom – all these are faithfully recorded on the tape. All these movements, small or great, demonstrate the workings of the Law of Supply and Demand. (Richard Wyckoff)
 
The Basic Law of Supply and Demand

I had been in Wall Street 20 years when I discovered that it was possible to judge the future course of the market by its own action. In my book, Wall Street Ventures and Adventures through Forty Years, I stated my experience and observations in 1909 as follows:
I saw more and more that the action of stocks reflected the plans and purposes of those who dominated them. I began to see possibilities of judging from the very tape what these master minds were doing. My editorial work was proving a most valuable means of self-education. In gathering material that would benefit my readers, 1 was actively searching out the stuff that would aid me personally. While my subscribers were given the best of what I collected, there was much in material discarded which helped to build up what I might call a code of enlightened procedure for use in this greatest of all the world’s games.

I had a friend who had been a member of the Exchange and who was well up on the technique of the market from the standpoint of the floor trader. We often discussed the difference between reading the tape simply to follow price changes (as most clients did) and reading the tape in order to judge the probable action of stocks in the immediate future.

Starting from the simple ground that the logical action of a stock was to decline when offerings exceeded the number of shares bid for, and to advance when the amount bid for was greater than the amount offered, we agreed that the quantity or volume of stock changing hands in each succeeding transaction was of great importance. Anyone who undertook to rend the minds of the momentary buyers and sellers was able to measure, to a certain degree, their eagerness or anxiety to buy or sell; also to measure the force of the buying power or selling power as shown by the number of shares; and to judge of the purpose behind the action, whether it was to buy without advancing the price, or to force the price up, or to mark it down, or to discourage buying or selling by others, as the case might be.

Each transaction carried with it certain evidence, although it was not always possible to interpret that evidence. All stocks no matter by whom they were owned, bought or sold, looked alike on the tape. But the purposes behind this buying and this selling were different and these might be fairly clear to those who understood market psychology.

Each transaction, although recorded only once, represented a meeting of minds; those of a buyer and a seller. This meeting of minds took place at a certain post on the floor of the Stock Exchange, even though the buyer might be in the far west and the seller in Europe.

Not all transactions were significant, but the interpreter must detect those which were. He must see that some indicated a purpose. Some one or some group was carrying, or attempting to carry, something through. He must take advantage of that.

Continuing my studies of the tape, I realized that the Basic Law of Supply and Demand governed all price changes; that the best indicator of the future course of the market was the relation of supply to demand.

The Law of Supply and Demand operates in all markets in every part of the world. When demand exceeds supply, prices rise, and when supply is greater than demand, prices decline. This is true not only of stocks; it is constantly being demonstrated in markets for wheat, corn, cotton, sugar and every other commodity that is bought and sold; also, it is reflected in other markets such as real estate, labor, etc.

I demonstrated this further in a series of articles entitled: “Studies in Tape Reading” which attracted wide attention as the first of their kind ever published anywhere, as far as I knew.

My basic idea in this series was that the stock market, by its own action, continually indicates the probable direction of its immediate and future trend, and anyone able to determine this with accuracy should attain success in trading and investing. [emphasis mine]

Coming events, I claimed, were foreshadowed on the tape because large interests there disclosed their anticipation of advances or declines by their purchases or sales. So, too, with the large speculator who was endeavoring to raise or depress prices. If one were to become sufficiently expert, he could judge by the action of stocks what was in the minds of these large interests and follow them.

The trend was simply the line of least resistance. When a stock met opposition in its rise, it must either be strong enough to overcome this resistance (selling) or it must inevitably turn downward, and when, in its downward course, sufficient buying was encountered to halt the decline, it would turn upward. The critical moments in all these various phases of the market were these minor and major turning points, or else the points where the price broke through the opposition into a new field.

Further development of this method of judging the market from its own action resulted in my using it as a basis for predicting the probable course of the market, and this eventually led to my issuing weekly, “The Trend Letter” (first published in 1911) which had a most successful career for many years. In fact, the forecasts contained in this Letter were so accurate that a large following was developed. As a result of a series of successful campaigns we were not only overwhelmed with business but brokerage houses throughout the country passed along these recommendations to their clients. So many followers were gained that an undue effect was had on the quotations for the stocks in which they traded, and in certain cases the effect on the market was important.

My reason for mentioning these facts is to show that this method of judging the market by its own action was highly successful from the standpoint of profits realized for subscribers who followed my advices, as well as for many thousands of people who were not subscribers but who bought and sold when we did.

From the above you may judge how vital it is in the stock market, as in every field, to operate with the proper principles. (Richard Wyckoff)
 
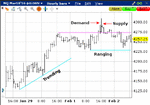
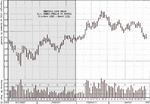
Before (posted 0936 NYT) and After (posted1630 NYT)

Among other things, this illustrates the interaction between demand and supply across two intervals: the daily and the hourly. He who monitors both simultaneously has a leg up.

One who understands how to interpret charts correctly can usually decide whether the whole market, or any single stock, or group of stocks, is most likely to advance, decline or stand still. Every market and every stock is always in a bullish, bearish or neutral position. The person who can determine, with a high percentage of accuracy, the position in which the market, or a group, or a certain stock stands, holds the key to success in trading and investing. (Richard Wyckoff)
 

Attachments

  • DSTR.gif
    DSTR.gif
    18.4 KB · Views: 1,417
  • DSTRb.gif
    DSTRb.gif
    38.7 KB · Views: 1,418
Last edited:
Judging the Market by its Own Action

The business of Wall Street is to finance corporations and to sell the securities - stocks and bonds - which result from this financing. Some securities are good; others not so good. Those who manufacture and sell them to the public know their value best. The public has comparatively little idea of their real value, except for seasoned securities – those which have been on the market for a long time and which, therefore, have established earning power and intrinsic value.

In every case the banker who does the financing and the dealers who help distribute, have paid for their securities either in cash or in services, or have underwritten them. The object is to market these stocks and bonds at as high prices as possible. This marketing is done through distributing houses and syndicates, by private sale, by public offering, and by means of listing on the stock exchanges.

In the latter case, the stock is advertised by making it active on the tape. If the price be advanced, and the transactions made large, the activity attracts buyers, and those who are handling the stock are thus able to dispose of their shares.

Sponsorship is sometimes continued after the market is thus made for a company’s shares. The bankers operate for themselves, or others operate for them. After a stock is floated, its sponsors try to create a stable market and support the price as well as they can without taking back too much stock. When it is thoroughly distributed and enough people are interested in the stock to make a market which takes care of itself, under ordinary conditions, the original banker, syndicate or sponsor may discontinue operations and turn attention to some other stock which affords a new opportunity for money-making.

Other interests may begin operations in that stock. Generally speaking, there are usually one or more sponsors or large operators working in every stock. Sometimes there are many. These interests see opportunities for profit, accumulate a line, mark up the price when conditions are favorable and then sell out. Or they may sell short, depress the price and cover.

No one can deny that in Wall Street the big fish eat the little ones. Large operators could not operate successfully without the large number of people making up the public; that is, if there were only ten big interests in the market and no public, these ten could only make a profit by dealing with each other. It would be difficult for one crowd to deceive any of the nine others. But when the public enters the stock market, the large operator’s game becomes easier for him.

Tape Reading and Chart Reading
enable one to detect and profit by these inside operations or manipulation; to judge the future course of stocks, by weighing the relation of supply and demand. This sometimes can be done from price movement alone, but if you consider also the volume of transactions you gain an additional and vitally important helpful factor.

By accurately judging this supply and demand, you are able to determine the trend of the whole market and of certain stocks [NB: as well as those instruments based on stocks, such as options, futures, ETFs]; also which stocks to buy or sell, and, what is even more important, when to do so.

You always aim to select the most promising opportunities; that is, the stocks which are likely to move soonest, fastest and farthest. You make no commitments without sound reasons and you avoid undue risks.

Whenever you study the tape or a chart, consider what you see there as an expression of the forces that lift and depress prices. Study your charts not with an eye to comparing the shapes of the formations, but from the viewpoint of the behavior of the stock; the motives of those who are dominant in it; and the successes and failures of the buyers and sellers as they struggle for mastery on every move.

The struggle is continuous. The tape shows all this in detail. The charts enable you to pick the market apart and study whatever portion or phase of it you choose.

Supply and demand may be studied on the tape of the stock ticker, and to even better advantage from charts.

The tape is like a moving picture film. Every minute of the day it is demonstrating whether supply or demand is the greater. Prices are constantly showing strength or weakness: strength when buyers predominate and weakness when the offerings overpower the buyers. All the various phases from dullness to activity; from strength to weakness; from depression to boom, and from the top of the market down to the bottom – all these are faithfully recorded on the tape. All these movements, small or great, demonstrate the workings of the Law of Supply and Demand. By transferring to the charts portions of what appears on the tape, for study and forecasting purposes, one is more readily enabled to make deductions with accuracy.

And now that you are undertaking to learn this Method, it is best that you prepare your mind for it by discarding most of the factors that you have heretofore employed in forming your judgment and making your decisions, such as: tips, rumors, news items, newspaper and magazine articles, analyses, reports, dividend rates, politics and fundamental statistics; and especially the half-baked trading theories which are expounded in boardrooms and popular books on the stock market.

It is not necessary for you to consider any of these factors because the effect of all of them is boiled down for you on the tape. Thus the tape does for you what you are unable to do for yourself; it concentrates all these elements (that other people use as a basis for their stock market actions) into the combined effect of their buying and selling.

You draw from the tape or from your charts the comparatively few facts which you require for your purpose. These facts are:
(1) price movement, (2) volume, or the intensity of the trading, (3) the relationships between price movement and volume and (4) the time required for all the movements to run their respective courses.

You are thus far better equipped than the man who is supplied all the financial news, statistics, etc., from the whole world. (Richard Wyckoff)
 
Last edited:
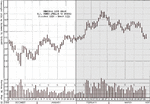
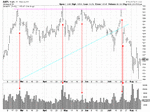
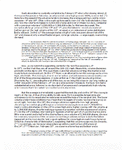
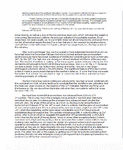
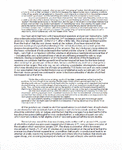
The following represents the first two months of a year-long analysis of the daily movements of what was then (1930-31) a major market average. The principles of demand and supply that applied then apply today. They haven't changed since the 30s. They haven't changed in principle since the days of the Samarrans, seven thousand years ago, much less Homma, the "father" of the candlestick, in the 18th century. Understand the Law of Supply and Demand and you will have overcome the most important hurdle faced by the trader/investor.

Db
 

Attachments

  • W chart Dec-Jan.gif
    W chart Dec-Jan.gif
    157.3 KB · Views: 1,023
  • 7M P4.gif
    7M P4.gif
    32.4 KB · Views: 939
  • 7M P3.gif
    7M P3.gif
    52.6 KB · Views: 897
  • 7M P2.gif
    7M P2.gif
    55.5 KB · Views: 970
  • 7M P1.gif
    7M P1.gif
    47.5 KB · Views: 1,195
In order to keep this thread as succinct as possible, I have restricted it with regard to comments and questions. Those who have either are welcome to submit them to me via PM, and I will transfer the most pertinent to this thread.

Db
 
Most of the popular prejudice against charts undoubtedly is due to the fact that many people mistakenly attempt to use charts mechanically – without judgment. They endeavor to draw diagrams or imaginary geometrical patterns on their charts, or apply arbitrary rules or systems such as “oscillators” and other impractical notions. Such methods are wrong. They lead only to errors, losses and discouragement. Therefore, you must remember this: When you study charts look for the motive behind the action which the chart portrays. Aim to interpret the behavior of the market and of stocks -- not the fanciful patterns (“gaps,” “horns,” “flags,” “pennants,” etc.) which the charts may accidentally form.
(Richard Wyckoff)
 
With respect to the above post, a contemporary example.

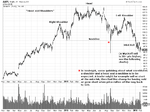
The "head and shoulders" pattern is a fan favorite, seen everywhere nearly all the time because it makes for such impressive conversational fodder amongst those who trade patterns. And while one might actually make money on the pattern in real time, it is always late compared to Wyckoff's method of focusing on the dynamic between demand and supply. Always.

Here is a typical and recent example of an H&S, discussed ad infinitum in blogs, articles, trading forums et al. The notations should be clear. (NB. I should point out here that this isn't really an H&S as the volume pattern is wrong, but so few traders know what the volume pattern is supposed to be that it virtually never comes up, which is a chief reason why H&Ss are seen around every corner and under every bed.)
 

Attachments

  • H&S arc1.gif
    H&S arc1.gif
    44 KB · Views: 1,391
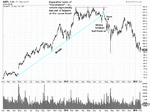
And a pinch of volume for extra flavor.

Note here that volume -- i.e., activity -- is heaviest on "down days". This doesn't mean that there are more sellers than buyers. There must be a buyer and seller for each transaction or else there's no transaction and thus no print. But if price is falling, holders are eager to get rid of what they have, and sellers are only too happy to offer bargain-basement prices. That is, after all, how professionals make their money. There are also inevitably a group of clueless bottom-fishing traders who think they're getting a bargain and are initiating positions or even doubling down. But this does nothing to elevate price.

In reference to the previous chart, above, the Wyckoff trader who incorporates volume into his decision-making might exit his trade if long or short if not already in when price breaks stride. Or if he has not yet conquered a tendency toward hopefulness, he might wait a little bit longer. But there is no Wyckoff trader who would stay with this given the last failure and the immediate gap down on high volume. This particular fat lady has sung.

And, no, one doesn't need color . . .
 

Attachments

  • H&S arc3.gif
    H&S arc3.gif
    44.1 KB · Views: 1,199
With regard to the above post, those who are particularly interested in volume will find the attached informative. Note that "overbought" and "oversold" conditions will be examined in further detail when we get to trends.
 

Attachments

  • Volume Studies.pdf
    109.5 KB · Views: 1,091
People are successful in business because, while they make mistakes at first, they study these mistakes and avoid them in the future. Then by gradually acquiring a knowledge of the basic principles of success, they develop into good business men.

But how many apply this rule to investing and trading? Very few do any studying at all. Very few take the subject seriously. They drift into the market, very often get "nipped" as the saying is, avoid it for a while, return from time to time with similar results, then gradually drift away from it, without ever having given themselves a chance to develop into what might be good traders or intelligent investors. This is all wrong.

People go seriously into the study of medicine, the law, dentistry, or they take up with strong purpose the business of manufacturing or merchandising. But very few ever go deeply into this vital subject (of trading and investing) which should seriously be undertaken by all. (Richard Wyckoff)
 
Continuing Wyckoff's year-long analysis of the market . . .
 

Attachments

  • 7M P5.gif
    7M P5.gif
    60 KB · Views: 888
  • 7M P6.gif
    7M P6.gif
    57.2 KB · Views: 835
  • 7M P7.gif
    7M P7.gif
    66.3 KB · Views: 784
  • 7M P8.gif
    7M P8.gif
    55.9 KB · Views: 811
  • 7M P9.gif
    7M P9.gif
    48.1 KB · Views: 821
  • W chart Feb-Mar.gif
    W chart Feb-Mar.gif
    155.9 KB · Views: 943
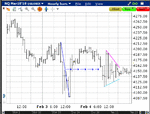
Several times in his year-long analysis of the market, Wyckoff refers to balancing or equilibrium and the resultant narrowing of the range of prices into what looks like a hinge. The NQ over the past couple of days has been engaged in this balancing act and conveniently provided this timely example.

The stock market with its various instruments (options, futures, ETFs, commodities, currencies, etc) is an auction market. The purpose of the auction market is to facilitate trade. A trade occurs when a buyer and a seller agree upon a price and complete the transaction. This transaction shows up as a print on the tape, or as a tick on a chart. It's the agreement part, however, that makes the whole thing interesting as price and value are not the same thing, and while the parties to this transaction may agree on a price, they need not and probably won't agree on value. It is the disagreements on value, after all, that move price, buyers thinking that X is worth more than it's selling for and sellers thinking it's worth less (Steidlmayer would resurrect all this decades later with Market Profile, but the origins are here, in Wyckoff).

Sometimes the disagreements on value can be miles apart. But it is an auction market and the purpose of the auction market is to facilitate trade, and this is brought about by the law of supply and demand. If there were no such law, the market would be chaotic and price movement would be random. Fortunately, this is not the case because there is such a law. Thus when there is a wide disparity of opinion over value and hence over price, these disagreements narrow into an ever-closer approximation of value vs price. There will always be at least some disagreement regarding value vs price or else price would never move. But these disagreements can become almost friendly, with lots of hand-shaking and resulting transactions (which is why volume, in the aggregate, tends to be heaviest as agreements on value are reached, that is, this is where most of the transactions are taking place, and over time they add up).

This particular example clearly shows this search for balance, or equilibrium. It begins two days ago with a wide range of opinion over value. But over those two days, and most clearly yesterday, these disagreements narrow, and a more general agreement regarding value and price occurs when trades reach an apex. This apex also represents what Wyckoff called a "springboard", also referred to in his analysis, that is, a preparation for an advance or decline away from this general though temporary agreement. Something will happen, an event, an earnings announcement, a planetary re-alignment, and the disagreements over value will again widen and prices will again fluctuate according to the law of supply and demand until the fluctuation reaches an extreme and we start all over again.

How to detect it in real time? Watch for lower highs and higher lows. When your longs aren't working out and neither are your shorts, sit back and relax and watch to see how these lower highs and higher lows evolve.

Edit: I should also remind the reader that Wyckoff mentions halfway levels in his analysis and how they can be used as measures of strength or weakness, even in real time. The apex of this hinge coincides with the halfway level of the rally from the January 19 low to the January 31 high.

Interesting how all of this dovetails.
 

Attachments

  • Hinge.gif
    Hinge.gif
    22.3 KB · Views: 1,341
Last edited:
Most of the popular prejudice against charts undoubtedly is due to the fact that many people mistakenly attempt to use charts mechanically – without judgment. They endeavor to draw diagrams or imaginary geometrical patterns on their charts, or apply arbitrary rules or systems such as “oscillators” and other impractical notions. Such methods are wrong. They lead only to errors, losses and discouragement. Therefore, you must remember this: When you study charts look for the motive behind the action which the chart portrays. Aim to interpret the behavior of the market and of stocks -- not the fanciful patterns (“gaps,” “horns,” “flags,” “pennants,” etc.) which the charts may accidentally form.
(Richard Wyckoff)

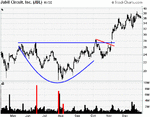
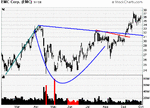
Time traveling again as before with the "head and shoulders" (post 8), now with the ever-popular "cup with handle". (A note, first: these were drawn from Google Images for the "cup with handle" and are therefore pretty much cherry-picked, that is they are selected by whoever posted them in the first place to show how the CWH works, but it very often doesn't, which is one reason, perhaps the most important reason, why one would do better to focus on the Wyckoff buy rather than wait for the buy point or buy level demanded by the pattern.)

As I'm sure everyone knows, the buy in a CWH occurs when price breaks out of the "handle". The Wyckoff buyer, however, buys long before this as a result of his analysis of and understanding of how supply and demand work in an auction market and of how predictable traders are (yes, behavioral finance begins here as well).

This first example is somewhat typical with regard to the climax low and test. However, the heavy activity (volume) illustrated by the first red bar may throw the trader off track. He may think that there's a lot of buying going on here as price seemed to find support at the previous swing low (10 or 11 bars earlier). And there was a lot of buying as traders with the wallets to back the effort were trying to support price up there. But there was also a lot of selling (there's a buyer and a seller for every transaction). The efforts to support price, however, eventually failed. Price was able to rally a bit, but there just wasn't enough demand, as became clear the next day and the days following. This volume did not, therefore, represent a "selling climax" (as explained in Wyckoff's year-long analysis of the 1930-31 market).

Next up is the actual selling climax with accompanying heavy activity, the second red bar, followed by the technical rally and the "test", accompanied by the much lighter activity highlighted by the third red bar. The Wyckoff trader would buy this, with a stop under the "danger level", that is, the climax low (if price were to breach this level, he'd know that he'd misinterpreted the activity, that he was in error regarding his buy, and he'd be out with a minimum loss).

The Wyckoff trader would be in below 20. The pattern trader would not be in until close to 28.
 

Attachments

  • Cup1.gif
    Cup1.gif
    22.3 KB · Views: 951
Another example, this one a bit more challenging. Here you have the usual climax low, climactic not because it is at the same level as the previous swing low but because of the activity. Buyers began their attempts to support price three bars earlier but this effort was only somewhat successful. Their next effort, the first red bar, did the trick. And then we have the usual technical rally followed by the test. This time, however, the test is accompanied not by lighter volume but by heavier volume. This can throw the mechanical trader, particularly the mechanical trader who trades patterns as heavy volume on a test is a no-no. However, the Wyckoff trader will understand that the message here is not that activity is heavier but that the heavier activity fails to drag price down to the climax low, much less breach it. Buyers, in other words, have called in reinforcements and they mean business. And this is where the Wyckoff buyer buys. He may sweat a little when price tests this level again a month later, but he may be calmed by the much lower level of activity during this subsequent test. And his stop is at the danger level anyway.

He is therefore in at 25. The pattern trader is in at 32.
 

Attachments

  • Cup 2.gif
    Cup 2.gif
    22.5 KB · Views: 883
The action of the whole market tells you when the selling is better than the buying and vice versa. You do not care why insiders are buying or selling, but you should care a lot about the action of their stock on the tape, for that is what tells you the truth. (Richard Wyckoff)
 
From the mailbag:

Quote from the second post of your thread, "THE BASIC LAW OF SUPPLY AND DEMAND":

"But the purposes behind this buying and this selling were different and these might be fairly clear to those who understood market psychology."
. . .

"Not all transactions were significant, but the interpreter must detect those which were. He must see that some indicated a purpose. Some one or some group was carrying, or attempting to carry, something through. He must take advantage of that."

My question:

Purpose. What indicates that we see any purpose in stock? From Wyckoff point of view I must identify purpose of forces which dominates. As I see from your point of view, we must look what traders are doing (as I understand that there is no Big player, but only crowd with its emotions and wishes). From the one hand there is conspirancy in order to fool people , from the other just traders who can be fooled by themselves.

Don't leave out what immediately precedes what you've quoted:

I had a friend who had been a member of the Exchange and who was well up on the technique of the market from the standpoint of the floor trader. We often discussed the difference between reading the tape simply to follow price changes (as most clients did) and reading the tape in order to judge the probable action of stocks in the immediate future.

Starting from the simple ground that the logical action of a stock was to decline when offerings exceeded the number of shares bid for, and to advance when the amount bid for was greater than the amount offered, we agreed that the quantity or volume of stock changing hands in each succeeding transaction was of great importance. Anyone who undertook to rend the minds of the momentary buyers and sellers was able to measure, to a certain degree, their eagerness or anxiety to buy or sell; also to measure the force of the buying power or selling power as shown by the number of shares; and to judge of the purpose behind the action, whether it was to buy without advancing the price, or to force the price up, or to mark it down, or to discourage buying or selling by others, as the case might be.


Wyckoff is talking here about trading on the floor. Floor traders had and have a finely-tuned sensitivity to demand, or buying power, and supply, or selling power, much more so than the average retail trader. It is their job to buy wholesale and sell retail, or buy low and sell high. They don't have the luxury of waiting around for multiple confirmations. If they do wait, they'll soon be out of a job. And they assess the level of demand and supply and the relationship between the two by activity (how much), pace (how fast), extent (how far). The mere fact that a stock is being traded indicates that there is interest in it. If there weren't, nobody would be trading it. If there is minimal interest, activity will be low, pace will be sluggish, and the extent of whatever moves it may make will be minimal. On the other hand, if there is interest in the stock, preferably considerable interest, then you've got something to dig your hands into (for illustrations of the difference between how "the trade" trades and the retail trader trades, see my earlier posts on Wyckoff entries vs pattern entries).

And here's where we get into note-taking and record-keeping.

At the time, there were no intraday streaming digital charts. There were no intraday charts at all. The physical tape was helpful, but even if one is keeping track of only one or two issues, remembering where price is and how it relates and related to what went before becomes quite a task. And if one attempts to keep detailed notes of transactions and transaction volume, his notes can quickly become as long as his arm and down his body to the floor and across the room and out the door and are soon useless.

Which is where point and figure comes in, a means of consolidating data so that it conveys information, of keeping notes of price movements in the sort of shorthand that takes up a fraction of the space of trade-by-trade notes and also a fraction of the mental space required if price is not for the time being going anywhere. Instead of an interminable list of prices and volumes, one has instead a concise bundle of Xs and Os, and as long as price doesn't escape from the upper or lower limits of those Xs and Os, one can assume that there is no particular purpose in the price movement unless there is accumulation or distribution going on (we haven't got to that yet). In that case, patterns of price movement and accompanying volume can be detected which tell the alert floor trader and tape reader that somebody is "acquiring a line", or establishing a position. This hypothesis will be confirmed when price "breaks out" of the sideways ranging movement that it has been exhibiting. Nowadays we do have intraday streaming digital charts and P&F isn't necessary. If one can draw a box, he can see whether price is trending or ranging. If it's ranging, there's nothing to do until price escapes from that range, or box (this is where the "Darvas Box" originated) unless he for some reason wants to trade inside that range, from top to bottom and back again.

As to "big players", they do indeed exist, from a few to several to many. And by "big" we mean that they have enough to move markets, like Goldman. Many people refer to these players as "smart money", but big money is not necessarily smart (examples of this are not difficult to find: google LTCM). But conspiracies? No. Amateurs who don't know what they're doing and screw themselves whine about brokers and market makers and the vast Wall Street if not global conspiracy to cheat them out of their money. But what The Money is doing is just business as usual, business as it's been for decades, if not centuries: accumulating enough of something in order to obtain at least a small corner of the market, creating a demand for it, feeding that demand, then reaping the rewards that that demand has provided (it goes on from here through distribution to mark-down, but that comes later as well; if this sounds like Stan Weinstein's "stages", that's because it all began here; those who just can't wait can read this). The trader who knows and understands what The Money is doing can take advantage of TM's activities while risking only a small fraction of the money being used by these movers and shakers.

Db

Figuratively speaking, the small trader should imagine himself as a hitch-hiker in the market. For the ordinary hitch-hiker, someone else supplies the car, chauffeur, oil and gas. When he thinks the car is about to go in his direction, he jumps aboard and rides as far as he thinks the car will go. When he notices the machine has been stopped by a red light, or is about to turn a corner and go in some other direction, or that the car is running out of gas, or the brakes failing to work properly, he steps off and figures he has secured about as long a ride as he may expect. All he has supplied in this transaction is a modest commission and whatever brains were necessary to observe and recognize the opportunity when to get on and off. (Richard Wyckoff)
 
From the mailbag:

"When demand exceeds supply, prices rise, and when supply is greater than demand, prices decline."

Why Wyckoff and you mentions every time this law. How we can take advantage from this? If price has rised we conclude that there is more demand then supply. if price has fallen we conclude that there is more supply then demand. Maybe he wanted to tell, when demand is greater then supply we should be in a buying mode? . . . the idea came to me: When demand is greater then supply, we should be in a buying mode. Price is telling that it is going up. You must decide what risk you will take, so where the most probable point to go long or short.

Is it possible to tell that there is more demand when price penetrates swing high of the previous wave up?

Study carefully what I've posted so far of his year-long analysis of what was then a major market average. Yes, when demand is greater than supply, one should be long or consider getting long. When supply is greater than demand, one should sell or sell short.

However, the balance between demand and supply changes second by second, and price moves in "waves" or "legs". One must therefore know and understand how to detect those turning points where the balance between demand and supply changes significantly enough to warrant assuming the risk of entering a trade AND know and understand how to stick with it until the evidence presented by price tells him that the trend is running out of gas and it's time to look for the exit (we'll get to this later with "trends"). Again, study carefully what I've posted of Wyckoff's major market analysis. The best Wyckoff traders re-read this at least once a year, sometimes once a month (beginners should probably read it once a week).

Db

Consider everything that appears on the tape as an evidence of support and lifting power, or pressure and selling power. Continually compare the strength of these forces. Use all the judgment and reasoning power at your command. Endeavor to improve your judgment by constant study and practice. Strive to lift your judgment from commonplace to good; from good to better; from better to excellent. (Richard Wyckoff)
 
Several times in his year-long analysis of the market, Wyckoff refers to balancing or equilibrium and the resultant narrowing of the range of prices into what looks like a hinge. The NQ over the past couple of days has been engaged in this balancing act and conveniently provided this timely example.

The stock market with its various instruments (options, futures, ETFs, commodities, currencies, etc) is an auction market. The purpose of the auction market is to facilitate trade. A trade occurs when a buyer and a seller agree upon a price and complete the transaction. This transaction shows up as a print on the tape, or as a tick on a chart. It's the agreement part, however, that makes the whole thing interesting as price and value are not the same thing, and while the parties to this transaction may agree on a price, they need not and probably won't agree on value. It is the disagreements on value, after all, that move price, buyers thinking that X is worth more than it's selling for and sellers thinking it's worth less (Steidlmayer would resurrect all this decades later with Market Profile, but the origins are here, in Wyckoff).

Sometimes the disagreements on value can be miles apart. But it is an auction market and the purpose of the auction market is to facilitate trade, and this is brought about by the law of supply and demand. If there were no such law, the market would be chaotic and price movement would be random. Fortunately, this is not the case because there is such a law. Thus when there is a wide disparity of opinion over value and hence over price, these disagreements narrow into an ever-closer approximation of value vs price. There will always be at least some disagreement regarding value vs price or else price would never move. But these disagreements can become almost friendly, with lots of hand-shaking and resulting transactions (which is why volume, in the aggregate, tends to be heaviest as agreements on value are reached, that is, this is where most of the transactions are taking place, and over time they add up).

This particular example clearly shows this search for balance, or equilibrium. It begins two days ago with a wide range of opinion over value. But over those two days, and most clearly yesterday, these disagreements narrow, and a more general agreement regarding value and price occurs when trades reach an apex. This apex also represents what Wyckoff called a "springboard", also referred to in his analysis, that is, a preparation for an advance or decline away from this general though temporary agreement. Something will happen, an event, an earnings announcement, a planetary re-alignment, and the disagreements over value will again widen and prices will again fluctuate according to the law of supply and demand until the fluctuation reaches an extreme and we start all over again.

How to detect it in real time? Watch for lower highs and higher lows. When your longs aren't working out and neither are your shorts, sit back and relax and watch to see how these lower highs and higher lows evolve.

Edit: I should also remind the reader that Wyckoff mentions halfway levels in his analysis and how they can be used as measures of strength or weakness, even in real time. The apex of this hinge coincides with the halfway level of the rally from the January 19 low to the January 31 high.

Interesting how all of this dovetails.

With regard to this post (14) and its accompanying chart, as follow-up, these comments were made today with regard to Wyckoff and the Wyckoff "days":

"I think its OK to look at the past and give examples etc - but as far as I am concerned today and next week is just not the same as even 8 years ago in trading FX - never mind back in Wychoff [sp] or Livermore days - the world as moved on - and so its just not the same - again like comparing a Model T Ford with a Bugatti Veryon - both cars with 4 wheels and an engine - but world's apart."

But if one had followed a few simple Wyckoff precepts today after I posted the above chart, long before the employment report was announced, he'd have participated in a 160pt move.

Good enough for me.

Db
 
Status
Not open for further replies.
Top