You are using an out of date browser. It may not display this or other websites correctly.
You should upgrade or use an alternative browser.
You should upgrade or use an alternative browser.
jamil005
Junior member
- Messages
- 27
- Likes
- 2
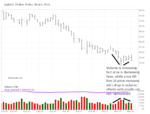
Crude
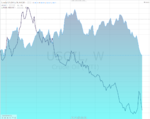
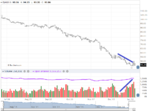
Daily volume since 17 October 2014 is decreasing but amazingly price is reluctant to slip down and making support at 79$.
Despite the fact IEA asks countries to hold 90 days of oil reserves, US has 247 days .. too much (courtesy PLATTS).
Daily volume chart courtesy cme group.
Daily volume since 17 October 2014 is decreasing but amazingly price is reluctant to slip down and making support at 79$.
Despite the fact IEA asks countries to hold 90 days of oil reserves, US has 247 days .. too much (courtesy PLATTS).
Daily volume chart courtesy cme group.
Attachments
jamil005
Junior member
- Messages
- 27
- Likes
- 2
At the end of week action i want to review my ideas and open for any nice suggestion or idea for discussion.
I am right now short in CL_ Jan_15 contracts @ 79.9 $, and establishing the sentiment that crude will touch 72$ support line (which i assumed after taking past 4 prices average of the month of (i) 3 March 2010-Low, (ii)1st August 2011-Low (iii) 3rd October 2011 and (iv) Ist June 2012 -Low.)
But right now i feel little butterflies in my stomach as current views and reviews are mixed, US crude stock pile is huge , china demand is low , OPEC is not interested in shorting supply, and very alarming that despite of unrest in russia -ukarine and some upsets in middle east ... THE crude price is behaving least concerned to political upsets, instead the crude is respecting more the impact of supply from middle east libya and local stocks. Net Blogs, post-cad, media, gurus,News etc etc are showing concern and giving reviews and views of mass and they are hoping for more lower price...which reminds me the mass emotional perception towards price (which tends to be wrong most of the time)
However if going through technical... the monthly Charts show 14 months low and negative sentiment... weekly chart is 3 bars short to confirm downward channel... Daily chart shows price support at 79-81 $.
Daily exchange Volume NYMEX is low , COT commercial ( i used to observe only commercial) are turning table towards Long (smart money) i.e. Comm. increased Long positions by 3.44% from previous reading.
Whereas Crude oil benchmark backwardation (i assume may be wrong that the current price or lower is not going to produce considerable pressure).
Note please that crude not only affected by US demand but also OECD countries too, and i think country growth do reflect in its currencies, i have attached EUR/USD comparison to WTI crude for reference.
I will be glad if i receive some good observations and views from traders on T2win.
(all figures are from free sources by , barchart, cme gorup and tradingview)
Attachments
Last edited:
jamil005
Junior member
- Messages
- 27
- Likes
- 2
The investor psychology
Browsing through "kiplinger" found very interesting QUIZ, i am sharing it for fun, ( Man separates from other creature because of mind where emotions live- Quote By me 🙂)
To help you make better investing choices, here are 8 questions plumbing insights from behavioral psychologists. See how you can avoid becoming your own worst enemy:
Question 1 of 8
We think something is safe because everyone is doing it. This is called...
A. Peer pressure
B. Herd behavior
C. Mental inertia
D. Insanity
The right answer is B. Herd behavior.
When markets rise, investors pile in. Then as portfolios swell, we start to feel a collective buzz courtesy of dopamine, a feel-good chemical that the brain produces at the mere thought of making money. The more dopamine is produced, the more primitive our decision-making becomes, making it harder to think logically.
Question 2 of 8
Which emotion do behavioral experts think drives people into rising markets when they see others making money?
A. Excitement
B. Envy
C. Regret
D. Optimism
The right answer is C. Regret.
Sure, excitement, envy, and optimism about making a killing may be factors. But it's the powerful emotion of regret for not having enjoyed the ride up, that causes those who can't stand being left out to jump in.
Question 3 of 8
Why do you see your investment as less risky when its value has been going up steadily?
A. Risk tolerance--you learn to handle risk.
B. Greed, plain and simple.
C. What's most recent in your mind is what stands out.
The right answer is C. What's most recent in your mind is what stands out..
It's called the Recency Effect, and it's what affected investors during the real estate and market run ups from 2003 to 2006. Smart people lost their sense of caution because they had known nothing but gains for several years. When investments go up, we start seeing them as less risky. So we look around for riskier investments. Big mistake.
Question 4 of 8
Human minds are hard-wired to organize facts around...
A. Spreadsheets
B. Love songs
C. Power Point presentations
D. Stories
The right answer is D. Stories.
Consider the fable of the Internet Bubble. There was a time 10 years ago when serious people believed the Web would lead to an unending explosion of commerce. Similarly, stories of people getting rich as property prices rose year after year inspired many more to move fast to get rich themselves--living happily ever after? They ignored mounting evidence of “bubbles” building in the real estate market. And like all bubbles, these popped.
Question 5 of 8
Speculative homebuyers in Las Vegas and Phoenix made a key mental mistake earlier this decade. What was it?
A. They bought too high and were too late to cash in.
B. They ignored obvious but important facts, such as the virtually infinite supply of land around both cities.
C. They listened to their inner demons. Now they must pay the price.
D. Mistake? What mistake?
The right answer is B. They ignored obvious but important facts, such as the virtually infinite supply of land around both cities..
Ignoring facts that puncture a “too-good-to-be-true” story is known as confirmation bias—we only look for things that support what we want to believe. In the case of real estate prices in Las Vegas and Phoenix that rose at double-digit rates, there were many warning signs that the increases couldn’t continue. One is that both cities are surrounded by hundreds of miles of vacant land, yet people saw real estate as a scarce commodity.
Question 6 of 8
When we lose money, our brain reacts in the same way that it processes…
A. Fear
B. Optimism
C. Pain
D. Envy
The right answer is C. Pain.
Losing money hurts. For many people, plunging portfolio values during the Panic of 2008 and the savage bear market of last winter became too much to bear. They just wanted the pain to end. So they sold. The timing couldn’t have been worse. As it turned out, stocks bottomed on March 9, 2009 and have surged more than 50% since then.
Question 7 of 8
What’s a smarter strategy than running with the herd?
A. Be a loner.
B. Stay out of the market until the direction is clear.
C. Don’t ever change or rebalance your portfolio.
D. Put all your money in one fund with a manager you like.
The right answer is A. Be a loner.
Think for yourself, using strategies to separate from the herd. So for example, if the U.S. government continues to run up massive deficits, you might be wise to move at least 20% to 40% of your assets out of the U.S., recommends one loner, Bob Rodriguez of First Pacific Advisors. Or perhaps follow the advice of another loner, Warren Buffett: Do your homework, select a portfolio of promising equities, and then hold on for 10 years.
Question 8 of 8
OK, so you recognize yourself in some of the miscues we’ve just described. How can you change your investing strategy to neutralize negative impulses?
A. Open a “safe money” account with low-risk investments that you think will hold up even during another stock-market crash.
B. Diversify your portfolio
C. Practice dollar-cost averaging.
D. Hire a good adviser to help you avoid bad impulses.
E. All of the above.
The right answer is E. All of the above..
What is dollar-cost averaging? By investing a fixed amount of money on a regular basis, which is how most employees contribute to their retirement plan, you avoid the temptation to buy high, or to pull out if the market tumbles.
Browsing through "kiplinger" found very interesting QUIZ, i am sharing it for fun, ( Man separates from other creature because of mind where emotions live- Quote By me 🙂)
THE INVESTOR PSYCHOLOGY
Emotion, not logic, usually rules our investing habits. In many ways, we're predisposed, not just to buy high and sell low, but to cling to losing investments we should sell, ignore threats to our wealth, and follow the investing herd off a cliff again and again.To help you make better investing choices, here are 8 questions plumbing insights from behavioral psychologists. See how you can avoid becoming your own worst enemy:
Question 1 of 8
We think something is safe because everyone is doing it. This is called...
A. Peer pressure
B. Herd behavior
C. Mental inertia
D. Insanity
The right answer is B. Herd behavior.
When markets rise, investors pile in. Then as portfolios swell, we start to feel a collective buzz courtesy of dopamine, a feel-good chemical that the brain produces at the mere thought of making money. The more dopamine is produced, the more primitive our decision-making becomes, making it harder to think logically.
Question 2 of 8
Which emotion do behavioral experts think drives people into rising markets when they see others making money?
A. Excitement
B. Envy
C. Regret
D. Optimism
The right answer is C. Regret.
Sure, excitement, envy, and optimism about making a killing may be factors. But it's the powerful emotion of regret for not having enjoyed the ride up, that causes those who can't stand being left out to jump in.
Question 3 of 8
Why do you see your investment as less risky when its value has been going up steadily?
A. Risk tolerance--you learn to handle risk.
B. Greed, plain and simple.
C. What's most recent in your mind is what stands out.
The right answer is C. What's most recent in your mind is what stands out..
It's called the Recency Effect, and it's what affected investors during the real estate and market run ups from 2003 to 2006. Smart people lost their sense of caution because they had known nothing but gains for several years. When investments go up, we start seeing them as less risky. So we look around for riskier investments. Big mistake.
Question 4 of 8
Human minds are hard-wired to organize facts around...
A. Spreadsheets
B. Love songs
C. Power Point presentations
D. Stories
The right answer is D. Stories.
Consider the fable of the Internet Bubble. There was a time 10 years ago when serious people believed the Web would lead to an unending explosion of commerce. Similarly, stories of people getting rich as property prices rose year after year inspired many more to move fast to get rich themselves--living happily ever after? They ignored mounting evidence of “bubbles” building in the real estate market. And like all bubbles, these popped.
Question 5 of 8
Speculative homebuyers in Las Vegas and Phoenix made a key mental mistake earlier this decade. What was it?
A. They bought too high and were too late to cash in.
B. They ignored obvious but important facts, such as the virtually infinite supply of land around both cities.
C. They listened to their inner demons. Now they must pay the price.
D. Mistake? What mistake?
The right answer is B. They ignored obvious but important facts, such as the virtually infinite supply of land around both cities..
Ignoring facts that puncture a “too-good-to-be-true” story is known as confirmation bias—we only look for things that support what we want to believe. In the case of real estate prices in Las Vegas and Phoenix that rose at double-digit rates, there were many warning signs that the increases couldn’t continue. One is that both cities are surrounded by hundreds of miles of vacant land, yet people saw real estate as a scarce commodity.
Question 6 of 8
When we lose money, our brain reacts in the same way that it processes…
A. Fear
B. Optimism
C. Pain
D. Envy
The right answer is C. Pain.
Losing money hurts. For many people, plunging portfolio values during the Panic of 2008 and the savage bear market of last winter became too much to bear. They just wanted the pain to end. So they sold. The timing couldn’t have been worse. As it turned out, stocks bottomed on March 9, 2009 and have surged more than 50% since then.
Question 7 of 8
What’s a smarter strategy than running with the herd?
A. Be a loner.
B. Stay out of the market until the direction is clear.
C. Don’t ever change or rebalance your portfolio.
D. Put all your money in one fund with a manager you like.
The right answer is A. Be a loner.
Think for yourself, using strategies to separate from the herd. So for example, if the U.S. government continues to run up massive deficits, you might be wise to move at least 20% to 40% of your assets out of the U.S., recommends one loner, Bob Rodriguez of First Pacific Advisors. Or perhaps follow the advice of another loner, Warren Buffett: Do your homework, select a portfolio of promising equities, and then hold on for 10 years.
Question 8 of 8
OK, so you recognize yourself in some of the miscues we’ve just described. How can you change your investing strategy to neutralize negative impulses?
A. Open a “safe money” account with low-risk investments that you think will hold up even during another stock-market crash.
B. Diversify your portfolio
C. Practice dollar-cost averaging.
D. Hire a good adviser to help you avoid bad impulses.
E. All of the above.
The right answer is E. All of the above..
What is dollar-cost averaging? By investing a fixed amount of money on a regular basis, which is how most employees contribute to their retirement plan, you avoid the temptation to buy high, or to pull out if the market tumbles.
jamil005
Junior member
- Messages
- 27
- Likes
- 2
jamil005
Junior member
- Messages
- 27
- Likes
- 2
Idea update
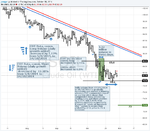
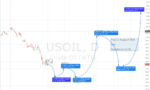
I am sharing my thoughts on crude as an image file, how ever concern to my previous short positions of CL JAN15 @ 79.9$, well i closed all of contracts on Thursday @78.1 $ well before Friday "US non-farm payroll" news (similarly i closed my GOLD FEB15 at 1145.00$ which i shorted @ 1231$). "it shows how much market can play in unpredictable manner"
On Friday when storm settled i entered again short @ 78.64 $ and 78.54 in scaling manner.
My bias is still that crude is going to building support @ 72$ zone.
Attachments
jamil005
Junior member
- Messages
- 27
- Likes
- 2
Guys please put some thoughts
Hi, i am still waiting for u guys to share some thoughts, waiting for healthy discussion but strictly related to WTI crude only.
So far in my perception the crude is slowly and steadily gaining strength but in very covertly manner.
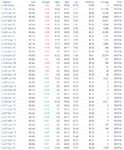
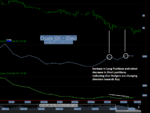
I am attaching my observation in figures in relative to:
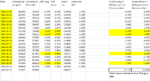
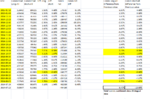
(a)COT data in which Commercials/hedgers are slowly shedding away short position and adding in long positions.
(b) Daily volume still shows little respect to long and increase in volume is tend towards downward direction of price , overall volume strength is not harmonized with price strength so that's why i am still short waiting for my target of 72$.
(c) using agriculture futures tool of basis , its seems that price is shifting to contango and giving opportunity to buy. ( Spot crude price is now lower than front-months contract, in figure spot price is shown in black colored line)
Looking forward for comments.
Hi, i am still waiting for u guys to share some thoughts, waiting for healthy discussion but strictly related to WTI crude only.
So far in my perception the crude is slowly and steadily gaining strength but in very covertly manner.
I am attaching my observation in figures in relative to:
(a)COT data in which Commercials/hedgers are slowly shedding away short position and adding in long positions.
(b) Daily volume still shows little respect to long and increase in volume is tend towards downward direction of price , overall volume strength is not harmonized with price strength so that's why i am still short waiting for my target of 72$.
(c) using agriculture futures tool of basis , its seems that price is shifting to contango and giving opportunity to buy. ( Spot crude price is now lower than front-months contract, in figure spot price is shown in black colored line)
Looking forward for comments.
Attachments
jamil005
Junior member
- Messages
- 27
- Likes
- 2
STEO report EIA
well what should we expect now after EIA Short term energy outlook report
http://www.eia.gov/forecasts/steo/report/global_oil.cfm
Its worth to be noted that EIA outlook released before OPEC important decision on 27 November 2014.
well what should we expect now after EIA Short term energy outlook report
http://www.eia.gov/forecasts/steo/report/global_oil.cfm
Its worth to be noted that EIA outlook released before OPEC important decision on 27 November 2014.
followtheplan
Newbie
- Messages
- 3
- Likes
- 0
Hello Jamil,
It's very informative that you shared your trade plans supporting with related info and your emotion with the on going plan I like your thread on the investor psychology. Regarding to the WTI crude, I would pose a question?
What conditions/events will cause a sudden increase of the WTI between now and Jan 2015? I was looking at the Nikkei equities 2 months ago, and asked a similar question.
jamil005
Junior member
- Messages
- 27
- Likes
- 2
Hello Jamil,
It's very informative that you shared your trade plans supporting with related info and your emotion with the on going plan I like your thread on the investor psychology. Regarding to the WTI crude, I would pose a question?
What conditions/events will cause a sudden increase of the WTI between now and Jan 2015? I was looking at the Nikkei equities 2 months ago, and asked a similar question.
Hi Bac Nguyen, well frankly, i started this thread with intentions to get inputs from other traders and get a chance to reevaluate my own ideas as i am a seeker too, but here you have placed a question in Socrates dialectics method, it put my own self for judgment, i will thank you for that.
concerning to WTI price behavior, i suppose that in general there are three main points to get fundamentals for price change in crude oil.
(1) Supply/Demand ("Supply": OPEC countries, Russia, USA, Lybia and OECD countries, "Demand": USA , OECD countries (note: OECD demand have major effect on crude oil prices [one can Google it for statistical data] and china)
(2) Political situations which harm supply of oil mainly OPEC region and Russia.
(3) Hedgers sentiment and daily volume change in exchange.
Now in building up a bias i thought that need of crude oil can only be diminished if it is replaced by other energy source and the world can observe a paradigm shift as same was witnessed in scenarios during replacement of 18th century DC electrical supply to AC electrical supply or crash of cho cho trains stocks in 1920’s or in 80-90’s conventional lens cameras which are almost replaced by digital cameras instead now one can have digital camera in mobiles, resulting in the low margin in the market for conventional cameras. well i don't think its time for petroleum products ultimate death.
Now to make a plan for entries I worked on following tips which I follow:
1. To get overall supply and demand I used to get statistical data from EIA website, as by myself haven’t got that resources to have huge information data. Also watch USA important news events from different websites which is available for free.
2. International news and events can also be followed by different websites, moreover knowing what the legend type people are doing right now, also have somewhat useful effect on making judgment (which maybe wrong but one can get ideas of big investor minds) like Jim Roger or Andre hall so called “Oil God”.
3. Regarding to hedgers sentiment I used to observe Long/Short positions of commercial positions reflected in COT data and if I see considerable change from previous level then I assume a change in the trend, whereas daily exchange trading volume helps me the support and resistance levels.
I used to put up some questions upon myself to calm my heart when making trades. ( basically I am a technical trader; that is chart trader to make entries and exit)
(1) Are the other source of energies occupied considerable share in the market…. No.
(2) World population and (despite of market slow down) Development is going negative….No.
(3) Crude oil is raw material and its consumable item i.e. upon usage it’s change to another state. Contemporary it’s a big source of energy and people, industries, communities do need its regular consumption. Is the usage has been changed right now……No.
Now here your question arises WHY I ASSUME that oil will re-bounce from 72$ to 117$ within 8 to 9 months. Well the ice line of 72$ is totally my own subjective level which I concluded by averaging historical supports. Also I smelled covert shedding shorts and adding Longs by hedgers from previous three months data of COT. And also previous reports by EIA, OPEC and Russia annual oil report of increasing demand and supply flat line during the period of Q15 and it gave added reason for my judgment.
But now the changed version of EIA Oil Supply report, unwilling in supply cut by the OPEC, & USA Shale oil supply determination despite being financially non viable below 80$ make me little thoughtful and reconsidering my bias.
I would like to let you know that we are traders, we are here to gain profits not fames, so detaching self from emotional traps we should be able to revive our ideas, that’s why I choose single commodity to trade in only one direction not quick swings but short time trades perceiving huge trends. So let’s see where I will end.
Wish you happy trading
jamil005
Junior member
- Messages
- 27
- Likes
- 2
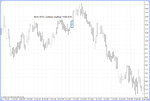
OPEC ordinary meeting 27 Nov 2014
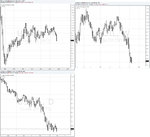
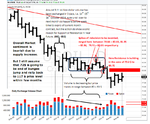
we got a OPEC ordinary meeting on thanks giving day, i don't know how the market will going to behave on that day either in Asian or European session, but just for fun i am attaching previous OPEC (ordinary/extraordinary) meetings date wise market action, i found that on OPEC meeting day (approximately) if Asian market opens around or below previous US sessions close, than we got a green bar i.e.US session market closes above Asian open or if Asian session opens well above previous day close of US session than we got a red bar i.e. that day US session close below Asian session open.
It should be noted that above judgment do not suggests any kind of market advice nor market entry/exit signal, i am sharing it just for information only.
(Its also worth to mention here that approximately after 3 to 5 day onward to 27 Nov 2014 meeting, the price action range will probably develop good support or resistance range)
Attachments
I have registered with www.tradecamp.net Open trading Room with Crude Oil trading. They announced Free registration at the moment. First week made good results.
jamil005
Junior member
- Messages
- 27
- Likes
- 2
jamil005
Junior member
- Messages
- 27
- Likes
- 2
2015 ???
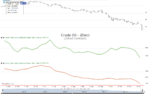
what a free fall we have observed in recent days, previously i thought shorts are nice sports wear, but sometimes it can makes a millionaire; now that's a beauty of trading.
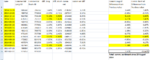
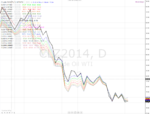
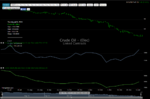
well in previous week observing commercials CoT data we saw accumulation; whereas daily volume increased; fig are attached
well technically i think 54$ is going to be support in few days targeting 72$ Resistance.
what a free fall we have observed in recent days, previously i thought shorts are nice sports wear, but sometimes it can makes a millionaire; now that's a beauty of trading.
well in previous week observing commercials CoT data we saw accumulation; whereas daily volume increased; fig are attached
well technically i think 54$ is going to be support in few days targeting 72$ Resistance.
Attachments
Last edited:
epic_research
Member
- Messages
- 52
- Likes
- 0
Really it's thread very helpful for all stock market investor .
Similar threads
- Replies
- 2
- Views
- 3K
- Replies
- 4
- Views
- 8K