hasanalali
Member
- Messages
- 87
- Likes
- 1
Dear traders do you like to see more harmonic charts soon will post
Hello hasanalali,nice work ,
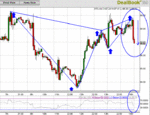
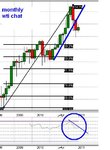
thought i'd post a simple weekly chart,
this looks like a bull flag to me,it looks like
93.00 the yellow line has become a base,note the
strong bullish outside bar when we went below the 93 level.
On the daily chart it looks like we need to test 100,above and
we breakout of the bull flag i think.
Hope you don't mind me posting.
Thanks for responding. I will continue to track your projections with interest and offer input where warranted. Thanks again
Thanks for the kind words Hasan.Thanks for your reply it's good to see your posts here jezek5
The presence of the flag gives the motivation for the price to rise looking to see the $100
:clover:
Thanks for the kind words Hasan.
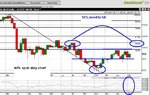
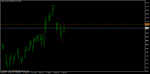
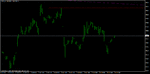
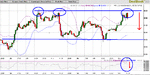
Two charts daily and 1 hr,looking at the daily
i can see we're playing an inside bar,shown by the
2 red lines,today we tested the lower level and it got
rejected,now it might be time to test the upper level,
might be interesting.
1 hr chart shows it much clearer.
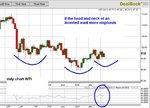
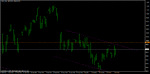
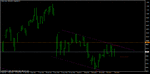
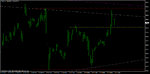
Just looked at a long shot 1 hr and it looks
to be coiling up,it looks like it's getting ready to
make a big move soon i think.
The daily looks a lot like a reverse H&S,time will tell.
Good trading Hasan.
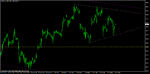
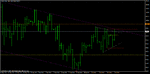
Looking punchy today,topside test looks to
be on the cards.
Just needs to clear this level.
Topside test but no breakout.....yet.
Looking for yellow dotted line to hold the pullback.
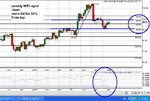
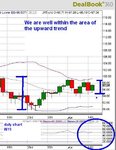
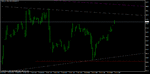
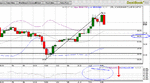
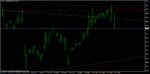
1H chart WTI
The price did not penetrate upper channel
you can see nice Divergence for small short coming
Maybe but the daily looks strong,we might just
test 100 before we pullback though.
Time will tell mate.
Good trading to you.