I’m not really into pinbars for all sorts of reasons, primarily that I no longer see the close as being a definitive ‘event’, rather more of an arbitrary ‘decision’ and also I’m far more interested in the intent of the price structure rather than its development.
Having said that though, there seems to be enormous interest in this particular chart structure and I wonder if you pinbar aficionados aren’t missing a trick or two…
If we take it that there exists a broad correlation between candle formations and pinbars it isn’t too far off beam to suggest a bear pinbar (heralding a potential bear reversal) is equivalent to Shooting Star and a bull pinbar (heralding a potential bull reversal) is equivalent to a Hammer. All on board so far?
But what about the Hanging Man and the Inverted Hammer?
The hanging man is pretty much the same structure as a bear reversal, but the pinbar is reversed, pointing back down into the ‘eyes’. As with the Inverted Hammer, this is a potential bull reversal with the ‘nose’ pointing back up into the ‘face’.
If you’re into pinbars, taking these two additional constructs into account will potentially double you potential trade setups.
I’ll be interested to see if any of you find the relative effectiveness of these two new ‘pinbars’ to be of a similar, or better, quality than the ones with which you currently work.
Well quite, what about the others?
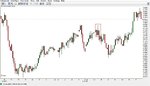
I thought to have a quick look at these close relations and randomly chose EUR/USD to run a quick back test.
The daily data I used goes back to June 1989. 4 hourly August 2003. Enough data to give a indication of the various candle's frequency and to see whether the next day produced a bull or bear candle. Incidentally the frequency on the hourly candles was too small to be of any use.
Here is the code used to define the candles
HangingMan = (((H-L)>4*(O-C)) AND ((C-L)/(.001+H-L)>= 0.75) AND ((O-L)/(.001+H-L)>= 0.75));
Hammer = (((H-L)>3*(O-C)) AND ((C-L)/(.001+H-L)>0.6) AND ((O-L)/(.001+H-L)>0.6)); }
InvertedHammer = (((H-L)>3*(O-C)) AND ((H-C)/(.001+H-L)>0.6) AND ((H-O)/(.001+H-L)>0.6));
ShootingStar = (((H-L)>4*(O-C)) AND ((H-C)/(.001+H-L)>= 0.75) AND ((H-O)/(.001+H-L)>= 0.75)); }
1. Hanging Man (Bullish)
Daily candles found since June 1989 = 34, next candle BULL=15 (44%) BEAR=19 (56%)
Four Hour candles since Aug 2003 = 13, " BULL=7 (54%) BEAR=6 (64%)
2. Hammer (Bearish)
Total candles found Daily = 209, next candle BULL=85(41%), BEAR=121(58%)
Four Hourly = 51, next candle BULL=28(55%) BEAR=22(43%)
3. Shooting Star (Bullish)
Total candles found Daily = 19, next candle BULL=11(58%) BEAR=8(42%)
Four Hourly = 3, BULL = 2 BEAR = 1
4.Inverted Hammer (Bearish)
Daily total found = 197, next candle BULL=103(60%) BEAR=90(46%)
Four Hourly = 40, next candle BULL = 24(60%) BEAR=16(40%)
Conclusions anybody?