Wot next? : Trade Management

Thanks for your contributions guys.

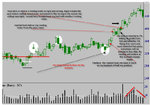
Just a word of explanation. There has been a lot on the boards recently about exit strategy, premature exitulation and the like. I thought it would be useful to "watch" a trade develop and to explain what's in traders minds as they manage that trade - I'm with Chump in believing it crucially important, perhaps THE most important.

I know that viewers will have different perspectives depending on their style and operating timescales but each can make their decisions as we go along and see whether they got the best out of the trade or not.

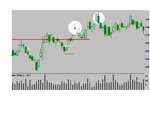
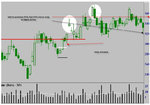
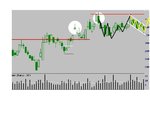
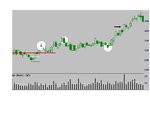
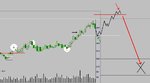
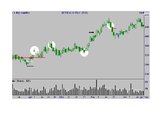
fwiw this is one of my old trades. I'd already exited half at 1:1 (expenses included) - when I went to b/e on the rest - by the stage of the last chart I had moved my stop to 304 just below the retracement after the shooting star (first chart) and was looking for a re-entry opportunity. The rationale behind this was relatively straightforward. Apart from the fact that it's my usual strategy, dealing with a potential major trend change in the early stages is a risky business and I like to get something off the table smartly, but leave something behind at no cost (b/e stop) in case it is a new trend that takes off.

tony - don't bow out :(

good trading

jon
 
ok, let's move on - I've white circled the last selected decision points so people don't have to keep scrolling back.

Right, the retracement starting at the last decision point halted at 312 so those with stops below that could be still running unless they've chosen to exit somewhere during this period of sideways drift (with a failure to move to new highs on the way).

Wot next, then? Any decisions to be made? If so, what and why?

good trading

jon

ps: and me? I'd made two new trades by this point (one for minus 16) - many of you know my style so you can guess where they were!!
 

Attachments

  • wotnext3.JPG
    wotnext3.JPG
    53.2 KB · Views: 234
Reasons...everything I am doing I am doing because of the prior downtrend...that downtrend was pretty much one way traffic...very little by way of pullbacks ,or ranging.
That means where we are now if it is the start of a new trend remains at the moment an area of disbelief as such after that first rally I expect a ranging market supported to attract accumulation so I am accumulating BUT doing so from a defensive position establishing no loss.
 

Attachments

  • wot next 3.jpg
    wot next 3.jpg
    62.6 KB · Views: 240
Bounced off the recent high to sucker in shorts (second white circle) down candles look strong. Stop was below 300 so we're still in. Upwards move from spinning top candle doesn't look convincing. Straining to break new lows, volume on last candle is the giveaway that this is a bull flag; weak selling is bought straight up. Accumulation on the way down from the bounce of the second test of the high and more weak shorts brought in thinking it's a double top resistance. Wait for break of the 'double top' before moving any stops. Up up and away!
 

Attachments

  • wot chart (2).JPG
    wot chart (2).JPG
    58 KB · Views: 228
Last edited:
Thanks Chump and Priceman - nice one pman:D

Moving it on a stage we find both chump and priceman are bowling along nicely - together with other viewers I hope (as long as you're being absolutely honest with yourselves :cheesy: )

Nice sustained rise taking us over 180 points from entry point at the peak with nothing to cause alarm bar the high volume up candle (arrowed) which some may have been a bit suspicious about. So here we are at the first bit of faltering and another decision to make.

Wot next, then? Any decisions to be made? If so, what and why?

good trading

jon

ps: there's a bit more to go with this one, but there doesn't seem a great deal of interest. Do you want me to carry on?
 

Attachments

  • wotnext4.JPG
    wotnext4.JPG
    47.3 KB · Views: 225
Hi Jon,

I'd better say something, just to let you know that I am reading this thread with interest!

I like those breakout patterns and if I had bought at that second opportunity, somewhere under that black, horizontal arrow, I would be taking profits now. That might go on down or consolidate for quite a long time. I'd wait for the next breakout.

I'm not a great believer in taking half the profits, it's my experience that I am unfortunate when I do that.

Good trading

Split
 
Jon,
I'm looking at the expected profit taking and pullback.Nothing about the vol not expected. Don't want to see vol getting too heavy next..want a pullback on light or decreasing vol then I want to see heavier vol stop the pullback to make me believe dip buying in...if that happens I wouldn't be increasing my position ,but I would put in a resting order for half at 492 and move my stop up for the other half to 445.
 

Attachments

  • wot next 4.jpg
    wot next 4.jpg
    86.5 KB · Views: 228
Not my words, but the rise to 450 was mentioned to me (which is where we are with Jon's latest chart ) and then a {edit}small pullback before a move toward the 500-ish level before coming back down to test the 240s.{edit}

Now this is without seeing the price and volume development chart by chart as we inch through the updates from Jon. This is ahead of time. A flat out high probability expectation based on, based on what?

I stand and stare in wonder. And interested expectation....Let's see.

{Just when I was thinking I was moonman material I realise I'm still in a cave, poking the fire with an animal bone...}


edit: QED!!! It wouldn't have been so bad if I had totally reversed what I had been told. Some sort of Alzheimer mirror-image affliction could have been held to blame, but it now appears I can’t even screw up properly.

I have amended the first para to reflect the original advices I was given. Apologies to all.
 
Last edited:
From a more traditional perspective (my current view), the penultimate bar represents clear indecision and is a down bar. The last bar is big down day on low volume. What does that mean? Probably no pro interest as they've already dumped their lines back onto the weak hands.

So I'm short with a first stop at 355 (first real potential Support) and depending on price and volume I'll review my position from there.
 
Good to see you posting Tony. Thought it was just chump and me playing! Been spending time on this chart and others this weekend with my mentor. I have to say a big thanks as I see things differently now, it's a real eye-opener :eek:

I'm now out of any position at the last but one candle, could even consider a short-term sell down to 400. Nah, let's not. The priority still lies in the long when the real action starts and volume shows us the way, backing up the buy. I buy back in at 400. Should even get upto 500-520 with the next move, then we reassess again. When it does get upto 500-520 there should be good selling down into the early lows. Obviously the red leg down is way in the future so that's the longer term view not the next imminent move.
 

Attachments

  • wotnext 0508.JPG
    wotnext 0508.JPG
    40 KB · Views: 240
Good to see you posting Tony. Thought it was just chump and me playing! Been spending time on this chart and others this weekend with my mentor. I have to say a big thanks as I see things differently now, it's a real eye-opener :eek:

I'm now out of any position at the last but one candle, could even consider a short-term sell down to 400. Nah, let's not. The priority still lies in the long when the real action starts and volume shows us the way, backing up the buy. I buy back in at 400. Should even get upto 500-520 with the next move, then we reassess again. When it does get upto 500-520 there should be good selling down into the early lows. Obviously the red leg down is way in the future so that's the longer term view not the next imminent move.

I was going to say what I would do if the chart followed your suggested route, but I realise that that would be jumping the gun, so am waiting for the next chart. At present, I am out of the market completely.

Did Barjon say that this was an up-to-date chart, because that would influence my thinking , too, just now. The share indices are not looking too bright at this time.

Split
 
Last edited:
Did Barjon say that this was an up-to-date chart, because that would influence my thinking , too, just now. The share indices are not looking too bright at this time.
No Split, we have no idea when these snapshots occurred.

I too feel a little out of whack with no context to work within. Not an excuse, just a comment.
 
ok, I think I'll draw this one to a close since the price proceeds from here without any particular quirks that haven't been considered previously in the thread. As you can see in this last chart it was IVZ (then AVZ) during the period April to July 2003. The price reached 570 before a semi-serious downturn (it's now around 616) which meant a near 100% rise in a 100 or so days.

You will see that there was the expected retracement from our last decision point (I exited all positions at the red line and entered a new long trade at the blue) and it then got back on track til it paused at the right hand edge again fooling a few into shorts with the "double top".

Just to re-cap. The thread was about managing a long trade entered at 292 and it has been about more than just exiting that single trade or placing appropriate stops. It has also encompassed exits and re-entries, the patient building of positions (a la chump) and a focus on the instrument rather than a focus on the numbers (how much am I making)

I hope you all found it interesting and thanks to all who participated - particularly chump and priceman.

Want another one?

good trading

jon
 

Attachments

  • wotnext5.JPG
    wotnext5.JPG
    59.4 KB · Views: 251
Want another one?
I think it's a useful exercise for all sorts of reasons Jon. For those that participate and for those that don't.

For me, it would really useful to have along with the undisclosed chart, a datestamp of some kind for me to pull up the overall market contexts within which it is developing. It makes all the difference to analyses and although I'm far from lost without it, it's taken me a long time and some real money to find out how much better I am with it.
 
Jon, just for completeness, could you post the wider angle chart on this one? Covering say the few months before the snapshot you started with and up to current day?
 
Tony

I can give you a bit more without it becoming too blurred.

here you go - the action we have discussed is between the two white circles.

good trading

jon
 

Attachments

  • wotnext5.JPG
    wotnext5.JPG
    102.8 KB · Views: 216
Top