Working with MA's

kevin546

Established member
Messages
699
Likes
0
This is an excellent thread. I have been trading for 4 years and after about 3 months realised I needed more than fundamental research. On discovering what charting had to offer I threw out the research and went into 3D charting.

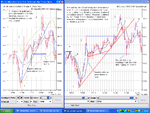
During the next 3 years as I went through different set-ups and time frames I gradually lost indicators. I watch the price closely and like others have already said I prefer bars to candles. I do like to use moving averages as I find they help when you have long bars or a congested area. I do make use of EMA bands on a 15 min chart but I no longer use any lower indicator, they have to many false signals for my liking. The best lower indicator signal is said to be divergence but to be honest if you follow the price you know when this is likely to come from the price action.

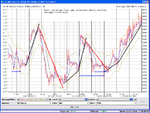
While I can see how some are making good use of the wave theory I have found it to difficult to always apply it to the letter. I prefer to watch the price and establish the immediate trend during an intraday session. I then look for support for this move after a change in direction and count the price moves up or down depending on the trend. The ema bands on the 15 min chart tend to illustrate the end of a price move or at least a correction period. I take note of the closing positions on each bar and how the price sequence tends to change in the last few minutes of a 5 min bar. Fast moving averages can help to identify the different price moves or waves, but I apply a close sma as a trendline which produces earlier signals than a conventional trendline along the tops or bottoms of bars. I use failed break through and failed re-tests for reversal signals and breaches of the ema channels for profit taking and or reversal.

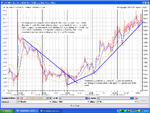
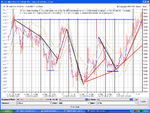
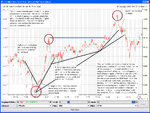
I make particular reference to trendlines and the slower rates seen as the trend comes to an end. I find the extending trendline a brilliant signal for safe reversal where the trendline once offered support, having been broken then offers resistence on the next move in the direction of the previous trend.

All in all I think your chart becomes less complex, clearer and your trading can improve. I trade the FTSE and they do not provide volume for this so I work entirely from price and the set-up I have previously mentioned.

I think more emphasis should be placed on the ability to read the price than any other method as I believe it is the fundamental charting tool.
 
MA, EMA or any variation of moving averages CROSS OVERS has ruined many Traders .. They all should be avoided and just stick to Price and volume action..

The problem with moving averages is that the Trader chooses an arbitary setings to filter the SHORTER TIME FRAME NOISE and then takes the signal given by the cross over to trade the LONGER TIME FRAME NOISE ..LOL :cheesy: :cheesy: .. The same argument appiles to RSI .. Why 14 period back and not 141 or 1400 or ...

years ago , I wasted huge amount of time to measure the cycle amplitude in a way to have more meaningful setting for my MA but my conclusion was , the dominant cycle shifts across many time frames back and forth in what seems to be a random behaviour that would make it impossible to gauge these data..

I am glad to see my fellow traders dumping indicators and watching the price action..
 
Last edited:
Grey 1
There are signals there in amongst the noise - are you saying that price/volume/vwap/timeframe gives the ideal signal noise ratio/
 
ROG,

No what I am saying is moving average ( SMA, or EMA ) can not identify the difference betwee noise and trend... VWAP strategy does not use cross overs of any kind and has no arbitary settings what so over..

regards
 
Grey1

"If the board is interested we can expand on the nitty gritty of my reasoning .."

I would be most interested in your reasoning. I did some work on FT filtering some time back. Basically take the tick dataset FFT apply low pass filter and FFT back to smooth the data. The trouble was that the bit I was most interested in was the right hand edge of the dataset [i.e. latest tick data] and the FT does not work well at what is effectively a data discontinuity. What you might call a null result so I abandoned it.

Apologies to the rest of the thread if this is getting off topic but it's the first time I've found someone who can shed some light on the matter. Hopefully will only take one more post and not clutter up the thread too much?

Bill
 
Last edited:
Bill,

You should have removed the trend from the tick data first before running FFT as a cycle length longer than you data would skew the values .. ( there are few ways of doing it but the most common method would have been to measure the trend first using least SQ and subtract the trend value from the original tick value.. You also have to make sure the beginning and the end data are the same value other wise you would get a wrong output.. This would result in discontinuity you have mentioned (you could use Hanning window to adjust data .. http://mathworld.wolfram.com/HanningFunction.html )

There are other requirements ..

Have you tried to use other techniques such as least SQ regression fitting to have more dynamic filter settings for MA .. it is much simpler and practical ‘’ lemme know if you are interested and I will expand on that ..
 
Regarding my previous post on this thread I thought I would illustrate my set-up.

Grey - regarding sma's I agree the crossover method has little benefit unless looking to trade a long term trend. However it depends how you use them. My 2 period sma is kept close to the price and I use this for my trendline analysis and not the price trendline. When using bars or candles and applying the trend in the correct manner, across the tops or bottoms then you can get a slower signal. Instead I work from a trendline created by the average price over a reasonable time depending on what time frame you are working from. I also use a 10 sma for impulse deals where I top up on the trend for a % of the next move. Using sma/ema's in this fashion you can get good signals very close to the price action, unlike the more popular methods of using moving averages.

I have changed my settings to try and posts my charts and in doing so they provide slightly less day coverage than I would normally display. I hope to be able to post each time frame from 5 min up to 60 min to illustrate how it can work on different time frames.

The 1st should be the 5 and 15 min charts from D4F. 5 min blue line = 2 sma, black line 10 period sma. 15 min has the addition of ema channels which is the set-up for the 30 and 60 min charts.
 

Attachments

  • ftse 19 dec 03 - 5 & 15m.1.png
    ftse 19 dec 03 - 5 & 15m.1.png
    92.1 KB · Views: 1,446
Right now for the bigger picture, 15 min chart covering 6 days
 

Attachments

  • ftse w.e 19 dec 03 - 15m 6 day monthly.1.png
    ftse w.e 19 dec 03 - 15m 6 day monthly.1.png
    87.5 KB · Views: 1,440
A couple of weeks from the 30 min perspective
 

Attachments

  • ftse w.e 19 dec 03 - 30m 10 days.1.png
    ftse w.e 19 dec 03 - 30m 10 days.1.png
    81.8 KB · Views: 1,005
Its the last one! 60 min chart for 14 days worth (normally I would get 6 days from the 15 min, 12 from the 30 min and 20 from the 60 min)
 

Attachments

  • ftse w.e 19 dec 03 - 60m 14 days.1.png
    ftse w.e 19 dec 03 - 60m 14 days.1.png
    89.3 KB · Views: 1,082
China,

Thanks again for you post..

Fourier transforms can be used on stationary data set . ( i.e the Rules that dictate the underlying process data remains stable and does not change ). Stock market data are different ..

An example of stationary process is coin flipping where the nature of flipping does not change unless you introduced some kind of weighted coins into the equation.. non stationary data's carry information such as stock data ( price is going up because of the upGrade ) or Speech ( it looks like noise first but speech spectrum carries valuable information )..Fourier transform can only be used on stationary data, hence sort of useless.. There are other filters to reduce noise from non statioanry data such as FIR, Order statistics which has been around for some time.. They can be bought from MESA site but they donot give you the edge one would wish to beat the market..
 
Kevin my friend,

The settings for your MA has come from you .. Ideally they should come from previous price action or Cycle and be dynamic to be useful...

Thanks for the Charts.. I totally understand your strategy ..

Grey1 means no disrespect to people's strategies as long as they are happy with it they should use it no matter what ...
 
Grey1

No problem, I was just trying to illustrate how some tools can be adapted to your own requirements and you do not always have to follow previous studies. I hope it adds to what I feel is a very interesting thread.
 
Grey 1
"Have you tried to use other techniques such as least SQ regression fitting to have more dynamic filter settings for MA .. it is much simpler and practical ‘’ lemme know if you are interested and I will expand on that .."
Lets hear it please
Ron
 
KEvin ,

It has certainly been an excellent contribution to this thread..
 
ROG,

Please enclosed find the word file which i have enclosed a working copy of the least SQ regression fitting system. It is a dynamic MA which adapts itself to previous data set .. It is an intelligent MA if you like..

The TS Code runs the least SQ regression technique and is a working copy for users of TS. This is the DOW chart. Can you see how good the MA has picked the trend of the DOW on Friday

PS;-- Just found a grammer error in the file and edited it but the number of the guys who down loaded the file shows zero instead of previous 20 ... Sharky Alert lol
 

Attachments

  • adaptive moving averages.doc
    22 KB · Views: 691
Last edited:
This is the Chart,, signal come from price penertating to above or below the Dynamic MA..
 

Attachments

  • ma1.jpg
    ma1.jpg
    47.5 KB · Views: 978
Another way to use a moving average. 1 min chart with 34 ema enter deals when ema line has turned towards new trend. It is not as close as some methods but this setting helps to avoid to many false entries. As long as you are prepared to use it this way and run with a trend then it works well. To make this chart clearer I have not included the 3 sma which I use to help close out of a position if not using a 15 min chart with channel breaches.

Grey1, I find your research about a more complex moving average very interesting.
 

Attachments

  • ftse 19 dec 03 - 1m.2.png
    ftse 19 dec 03 - 1m.2.png
    67 KB · Views: 868
Grey1

If you get the chance could you post the DOW covering a full session using the 1 min chart with your moving average setting. It would be helpful to see how it performed through- out the full session with the differing market idiosyncrasies.
 
Sure Kevin .. This is the full day .. It would have been very proftable if one used mechanically all the signals by the dynamic MA.. Sorry for the pic quality
 

Attachments

  • ma2.jpg
    ma2.jpg
    69.9 KB · Views: 886
Top