This is an excellent thread. I have been trading for 4 years and after about 3 months realised I needed more than fundamental research. On discovering what charting had to offer I threw out the research and went into 3D charting.
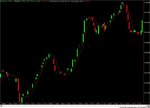
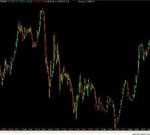
During the next 3 years as I went through different set-ups and time frames I gradually lost indicators. I watch the price closely and like others have already said I prefer bars to candles. I do like to use moving averages as I find they help when you have long bars or a congested area. I do make use of EMA bands on a 15 min chart but I no longer use any lower indicator, they have to many false signals for my liking. The best lower indicator signal is said to be divergence but to be honest if you follow the price you know when this is likely to come from the price action.
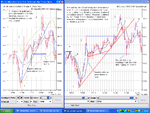
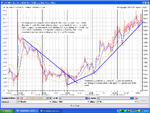
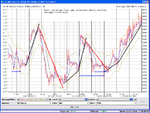
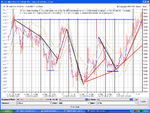
While I can see how some are making good use of the wave theory I have found it to difficult to always apply it to the letter. I prefer to watch the price and establish the immediate trend during an intraday session. I then look for support for this move after a change in direction and count the price moves up or down depending on the trend. The ema bands on the 15 min chart tend to illustrate the end of a price move or at least a correction period. I take note of the closing positions on each bar and how the price sequence tends to change in the last few minutes of a 5 min bar. Fast moving averages can help to identify the different price moves or waves, but I apply a close sma as a trendline which produces earlier signals than a conventional trendline along the tops or bottoms of bars. I use failed break through and failed re-tests for reversal signals and breaches of the ema channels for profit taking and or reversal.
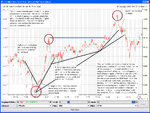
I make particular reference to trendlines and the slower rates seen as the trend comes to an end. I find the extending trendline a brilliant signal for safe reversal where the trendline once offered support, having been broken then offers resistence on the next move in the direction of the previous trend.
All in all I think your chart becomes less complex, clearer and your trading can improve. I trade the FTSE and they do not provide volume for this so I work entirely from price and the set-up I have previously mentioned.
I think more emphasis should be placed on the ability to read the price than any other method as I believe it is the fundamental charting tool.

