A few weeks ago I talked to 15 different traders: 5 of them have been trading for less than a year, 5 of them have been trading for 1-2 years, and 5 of them have been trading for over 2 years. I asked each of them if they use volume in their trading, and because they know how important I think volume and price action are, they all responded "yes".
Having established that all 15 of these traders are using volume, I wanted to know exactly how they are using it and whether or not they are using it correctly. I remember as a newer trader I always would say that I was using volume but I really didn't know how to properly utilize volume. So I spend just a minute or so showing each of these traders a chart and asked them to analyze exactly what the volume on the chart is telling us and where we would want to take a position. The results of the survey showed the following:
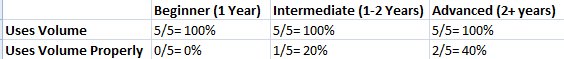
You can see that only 3 out of 15 traders, or 20%, actually know how to properly use volume in their trading. It certainly wasn't a surprise to me that beginner and even intermediate traders don't know how to use volume, but the fact that even advanced traders didn't know how to properly analyze volume was mind boggling to me.
A few months ago I authored, produced, and published a video trading course that outlined specific price action methods and most importantly talks about how I use volume to spot trades. Today, in light of the results I have found and the lack of understanding that exists about volume, I would like to share with you part of just one of the lessons that I teach in an effort to at least get you headed down the right road in terms of volume.
So just what is volume? Volume is most simply the measure of transactions taking place in the market. So for any one unit of volume we see a transaction, or a buyer paired with a seller, taking place. So why is it important to analyze the level of volume with respect to price movements?
Well, simply put, it is important because we need to know how many people are placing trades at given areas. Remember, supply and demand are what move price, so if we see a large increase in volume followed by a large price movement, we know that there is a very high amount of demand and a relatively low amount of supply. We can then place our trades accordingly and follow the crowd or momentum as price moves higher.
Recently I was getting ready to place a trade on Apple ( $AAPL ) when I found myself using volume to decide if I should get long or short.
As a newer trader, I would see price approaching an area of resistance, for example, and I never would know if I should get short and assume price would bounce off resistance or if I should get long and assume price is going to break out. Well, in the following example, I used volume to tell me exactly what price was going to do next.
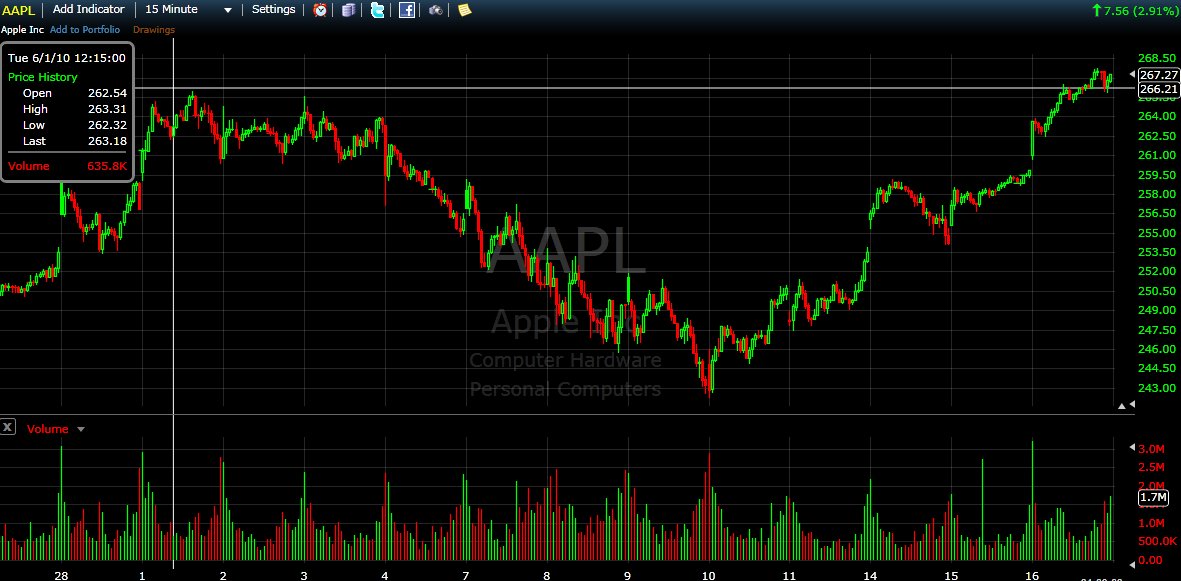
In the following chart you will see elevated volume as well as relatively large upward price movements. Price was quickly approaching prior resistance between the $265.80 and $266 area, and I was getting ready to take a short position as price approached this area. However, I always, and I repeat I always, look at volume before placing any trades, and I saw that for mid-morning volume was as high as it normally is during the open or close. This told me that there are a lot more participants taking part in this price movement than normal for this time of day, so I knew that price was much more likely to break through resistance than to bounce off it.
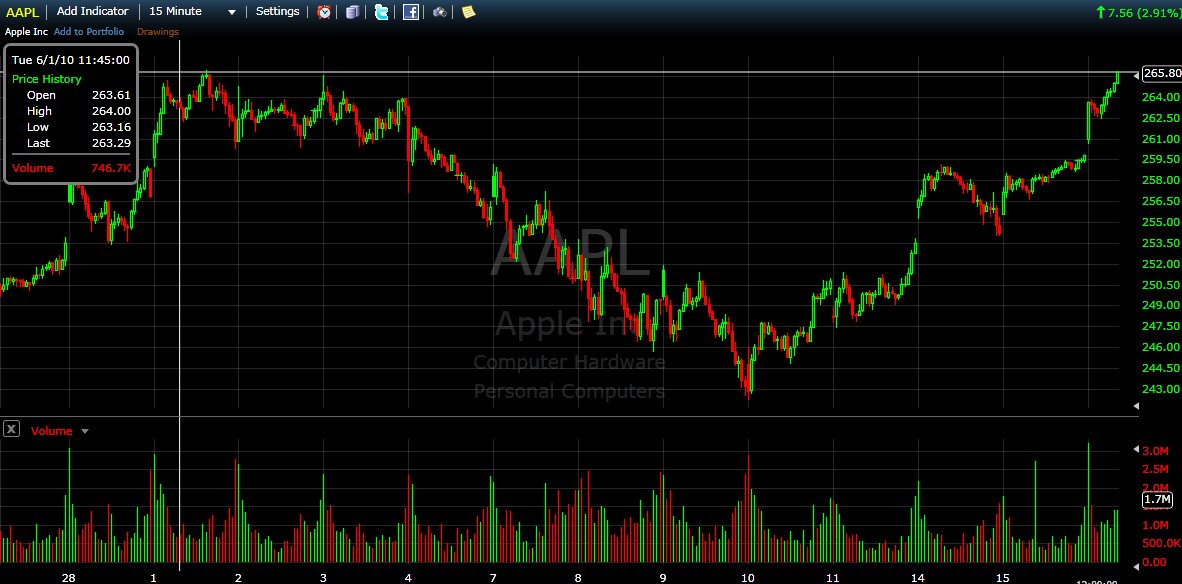
Rather than fight volume and fight momentum, I looked to take a short position instead. And while price did temporarily pullback when hitting resistance, volume returned into the picture a bit later in the day and caused price to continue upward, as high as about $268.50. This represents a $2+ price movement in just a matter of an hour or so, which is a great amount of price movement for such a high probability, high reward, and low risk scenario.
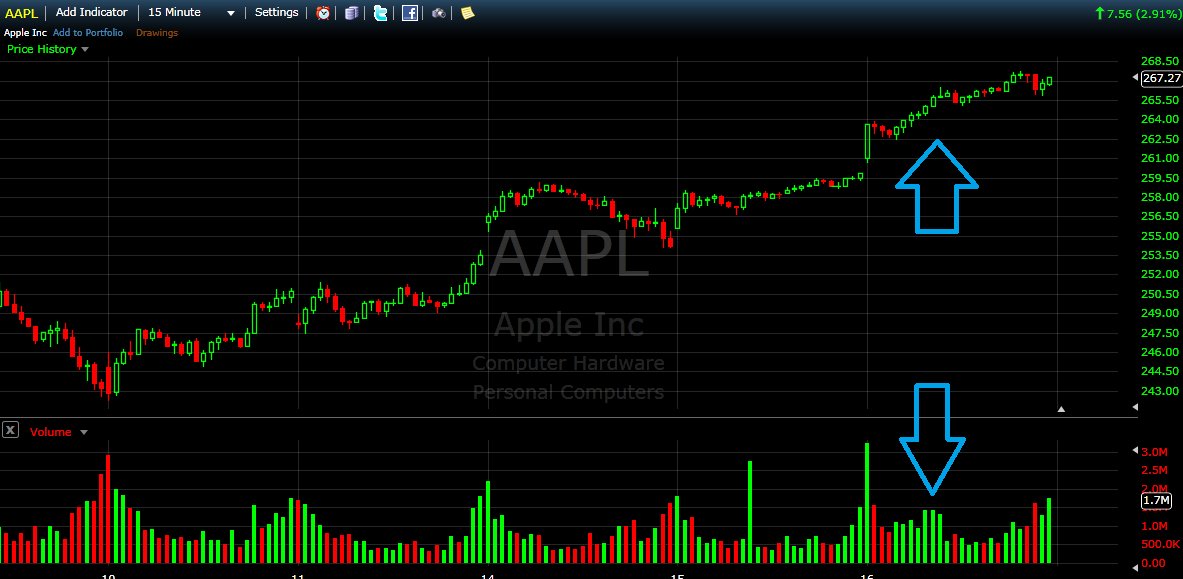
Let's zoom in and look at exactly what happened and exactly why I didn't take a short position. In the chart below, we can clearly see elevated volume and upward price movements. As price approached the area of resistance, we can see that the buyers backed off, which is shown in lower volume, because they waited for the sellers to jump into the picture and cause price to pull back some. However, the sellers were scared of all the volume they just saw (like myself who was not willing to get short (
here) so price was only able to pull back ever so slightly. When the buyers realized this, they all jumped back into long positions or got into new long positions, and added to the demand and volume at this given area.
Following this event, we saw price break right through resistance and do so quite strongly, leaving us with a picture perfect trade.
Through just this one example, I hope you will not only have a slightly better understanding for what volume is and how I use volume, but more importantly I hope you will start to use volume in your trading if you are not already. I truly hope you will be one of the few traders out there that actually uses volume properly. There are thousands of factors that can influence the outcome of any trade that you place, and by adding volume to your trading edge you just have that much more of an advantage over every other trader in the markets.
Brendan Egan can be contacted at 123LearnToTrade
Having established that all 15 of these traders are using volume, I wanted to know exactly how they are using it and whether or not they are using it correctly. I remember as a newer trader I always would say that I was using volume but I really didn't know how to properly utilize volume. So I spend just a minute or so showing each of these traders a chart and asked them to analyze exactly what the volume on the chart is telling us and where we would want to take a position. The results of the survey showed the following:
You can see that only 3 out of 15 traders, or 20%, actually know how to properly use volume in their trading. It certainly wasn't a surprise to me that beginner and even intermediate traders don't know how to use volume, but the fact that even advanced traders didn't know how to properly analyze volume was mind boggling to me.
A few months ago I authored, produced, and published a video trading course that outlined specific price action methods and most importantly talks about how I use volume to spot trades. Today, in light of the results I have found and the lack of understanding that exists about volume, I would like to share with you part of just one of the lessons that I teach in an effort to at least get you headed down the right road in terms of volume.
So just what is volume? Volume is most simply the measure of transactions taking place in the market. So for any one unit of volume we see a transaction, or a buyer paired with a seller, taking place. So why is it important to analyze the level of volume with respect to price movements?
Well, simply put, it is important because we need to know how many people are placing trades at given areas. Remember, supply and demand are what move price, so if we see a large increase in volume followed by a large price movement, we know that there is a very high amount of demand and a relatively low amount of supply. We can then place our trades accordingly and follow the crowd or momentum as price moves higher.
Recently I was getting ready to place a trade on Apple ( $AAPL ) when I found myself using volume to decide if I should get long or short.
As a newer trader, I would see price approaching an area of resistance, for example, and I never would know if I should get short and assume price would bounce off resistance or if I should get long and assume price is going to break out. Well, in the following example, I used volume to tell me exactly what price was going to do next.
In the following chart you will see elevated volume as well as relatively large upward price movements. Price was quickly approaching prior resistance between the $265.80 and $266 area, and I was getting ready to take a short position as price approached this area. However, I always, and I repeat I always, look at volume before placing any trades, and I saw that for mid-morning volume was as high as it normally is during the open or close. This told me that there are a lot more participants taking part in this price movement than normal for this time of day, so I knew that price was much more likely to break through resistance than to bounce off it.
Rather than fight volume and fight momentum, I looked to take a short position instead. And while price did temporarily pullback when hitting resistance, volume returned into the picture a bit later in the day and caused price to continue upward, as high as about $268.50. This represents a $2+ price movement in just a matter of an hour or so, which is a great amount of price movement for such a high probability, high reward, and low risk scenario.
Let's zoom in and look at exactly what happened and exactly why I didn't take a short position. In the chart below, we can clearly see elevated volume and upward price movements. As price approached the area of resistance, we can see that the buyers backed off, which is shown in lower volume, because they waited for the sellers to jump into the picture and cause price to pull back some. However, the sellers were scared of all the volume they just saw (like myself who was not willing to get short (
here) so price was only able to pull back ever so slightly. When the buyers realized this, they all jumped back into long positions or got into new long positions, and added to the demand and volume at this given area.
Following this event, we saw price break right through resistance and do so quite strongly, leaving us with a picture perfect trade.
Through just this one example, I hope you will not only have a slightly better understanding for what volume is and how I use volume, but more importantly I hope you will start to use volume in your trading if you are not already. I truly hope you will be one of the few traders out there that actually uses volume properly. There are thousands of factors that can influence the outcome of any trade that you place, and by adding volume to your trading edge you just have that much more of an advantage over every other trader in the markets.
Brendan Egan can be contacted at 123LearnToTrade
Last edited by a moderator: