Where to start with fundamentals?...

Found an article by a private individual on Gold-Stock Market correlation (full article on blog can be found here). I'll just quote some of the main points made in the article...


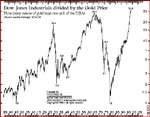
The chart below that I 'borrowed' gives a visual idea of the correlation... So, inflation is bad for the market, and thus gold is seen as a hedge because of its residual (or intrinsic) (I think) value. "uncertain times", I presume, would encapsulate such things as war or recession - not sure what else though.


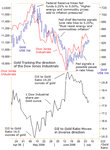
So the chart below shows the inverse-relationship between gold and the stock market. The fairly rapid fall in the price of gold while the market rises from the low in March. And apparently the US Dollar is even more inversly correlated with gold than the stock market is - more on this later...

so if Gold has an inverse relationship with the dow. We should be looking for a sell off, of Gold (or an lease for Gold to not rise further) as a confirmation that Greys long call at the moment is correct. (ie the money that was paniced into gold when the financials fell over, will return to the stock market.)

however the bigger historical cycle between Gold and the dow (looooong term) would suggest that gold has further to rise (or the dow has further to drop) the ratio dow/gold is around 15 at the moment comming of its peek of 30ish in the late 1990's early 2000's?????????

belflan
 

Attachments

  • Dow vrs Gold.JPG
    Dow vrs Gold.JPG
    63.6 KB · Views: 13
however the bigger historical cycle between Gold and the dow (looooong term) would suggest that gold has further to rise (or the dow has further to drop) the ratio dow/gold is around 15 at the moment comming of its peek of 30ish in the late 1990's early 2000's?????????

maybe this could be very bullish sign for gold long term if the dow continues to rise?
 
Capital Asset Pricing Model (Pt 2) - Beta...

Perhaps the single most important measure of stock risk or volatility is a stock's beta. It's one of those at-a-glance measures that can provide serious stock analysts with insights into the movements of a particular stock relative to market movements.

The concept of beta is actually very simple - it's a measure of individual stock risk relative to the overall stock market risk. It's sometimes referred to as financial elasticity. It's just one of several values that stock analysts use to get a better feel for a stock's risk profile. As we'll see later on in our discussion, the beta value is calculated using price movements of the stock we're analyzing and comparing those movements to an overall market indicator - such as a market index - over the same period of time.

Beta Rules of Thumb

Beta values are fairly easy to interpret. If the stock's price experiences movements that are greater - more volatile - than the stock market, then the beta value will be greater than 1. If a stock's price movements, or swings, are less than those of the market then the beta value will be less than 1.

Since increased volatility of stock price means more risk to the investor, we'd also expect greater returns from stocks with betas over 1. The reverse is true of a stock's beta is less than 1 - we'd expect less volatility, lower risk, and therefore lower overall returns.

Okay. Here are some advantages to using Beta...

The calculation of beta is based on extremely sound finance theory. The CAPM pricing theory is about as good as it gets when it comes to pricing stocks and is far easier to put into practice when compared to the Arbitrage Pricing Theory or APT. If you're thinking about investing in a company's stock, then the beta allows you to understand if the price of that security has been more or less volatile than the market itself - and that's certainly a good thing to understand about a stock you're planning to add to your portfolio.

If we understand the theory behind beta, then it's easy to understand how emerging tech stocks typically have beta values greater than 1, while 100 year-old utility stocks typically have beta values less than 1. In fact, in March 2007 Priceline.com had a beta of 3.4 while Public Service Enterprise Group had a beta of 0.57. It's nice when theory seems to work in the real world.

... and disadvantages...

Unfortunately if you're calculating stock beta values using price movements over the past three years, then you need to bear in mind that the "past performance is no guarantee of future returns" rule applies to beta.

Beta is calculated based on historical price movements - which may have little to do with how a company's stock is poised to move in the future. And because the measure relies on historical prices it's not even possible to accurately calculate the beta of newly issued stocks.

Beta also doesn't tell us if the stock's movements were more volatile during bear markets or bull markets - it doesn't distinguish between large upswing or downside movements. So while beta can tell us something about the past risk of a security, it tells us very little about the attractiveness or the value of the investment today.

These explanations are very clear. Although the beta of most stocks is available from various online resources, it would also be good to have an understanding how beta is calculated.

You can also calculate beta yourself using a fairly straightforward linear regression technique that's available in a spreadsheet application such as Microsoft's Excel or OpenOffice Calc.

In fact, to calculate a stock's beta you only need two sets of data:

--> Closing stock prices for the stock you're examining.
--> Closing prices for the index you're choosing as a proxy for the stock market.

Most of the time beta values are calculated using the month-end stock price for the security you're examining and the month end closing price of the S&P 500 Index ($INX).

The formula for the beta can be written as:

Beta = Covariance (stock versus market returns) / Variance of the Stock Market

Covariance is a bit more involved than I would like to get at the moment. I don't want to wander too far away from the CAPM here. However, I have attached a spreadsheet that was provided with one of these articles. It is quite clear.

Beta is represented in the CAPM as ß...
 
Dow <-> Gold...

maybe this could be very bullish sign for gold long term if the dow continues to rise?

belflan, this does seem to tie in with an article I found here...

Most interesting, there has been a recent evolution of market psychology, expressed by the close correlation between gold prices and major stock market indexes. In the US, gold is closely tracking the direction of the Dow Jones Industrials, and the only question is which market will outperform the other. Such a tight relationship stands in stark contrast to the inverse correlation witnessed in 2000 thru 2002.

Chart attached...


Magnus
 

Attachments

  • dowgold.jpg
    dowgold.jpg
    179.1 KB · Views: 15
Capital Asset Price Model (Pt 3)...

Right, this is what we have so far in the CAPM...

rf = The risk-free interest rate is the interest rate the investor would expect to receive from a risk-free investment. Typically, US Treasury Bills are used for US dollars and German Government bills are used for the Euro.

ß = A stock beta is used to mathematically describe the relationship between the movements of an individual stock versus the market itself. Investors can use a stock's beta to measure the risk of a security versus the market.

Now, we have one more variable that is used in the CAPM - this is the expected market return...

rm = The expected market return is the return the investor would expect to receive from a broad stock market indicator such as the S&P 500 Index. For example, over the last 17 years or so, the S&P 500 has yielded investors an average annual return of around 8.10%.

So what exactly is this CAPM formula telling us? The formula states that the expected return of a stock is equal to the risk-free rate of interest plus the risk associated with all common stocks (market premium risk) adjusted for the risk of the common stock we're examining.

This means the investor can expect a rate of return on this asset that compensates them for both the risk-free rate of interest, the stock market's risk and this particular stock's risk - it all makes sense.

The CAPM formula thus gives us an expected rate of return...

Expected Rate of Return = r = rf + ß (rm - rf)


Magnus
 
Last edited:
Capital Asset Price Model (Pt 4)...

Okay, let's have an example of how to use the CAPM...

Pick a company the most people know... Google (GOOG)

GOOG is traded on Nasdaq, but we will use the S&P500 as the reference index (I can't see it making much difference - they move very much in tandem)...

Assume a risk-free interest rate of 6.0%...

So we have,

rf = 6.0

ß = 2.6 (source: Yahoo)

rm = 8.1 (taken from previous post - CAPM Pt3)


Expected Rate of Return = r = rf + ß (rm - rf)

=> 6.0 + 2.6 ( 8.1 - 6.0 )

=> 6.0 + 2.6 * 2.1

=> 6.0 + 5.46

=> 11.46%

So we have an expected rate of return from Google of 11.46%

See attached chart of the S&P overlayed on GOOG. A good visualisation of beta...

Magnus
 

Attachments

  • SandP-GOOG.gif
    SandP-GOOG.gif
    7.9 KB · Views: 14
C.A.P.M. is not really fundamentals though, is it?...

After going through and learning [the very basics of] the CAPM, I'm still unclear as to how helpful it is in gauging fundamentally strong/weak stocks. I think I may have missed something, or at least made an incorrect assumption, about what CAPM actually tells us.

It looks to be that the CAPM essentially only tells us if a stock is relatively strong/weak compared to a relevant reference market. From what I see, it doesn't tell us anything about the stock fundamentally. Is it a proverbial diamond in the rough or is it an "Enron" :-0?...

Maybe this does not actually matter. Perhaps, just following what the market is doing and, as Iraj espouses, only long in strong stocks when the market is rising and only short weak stocks when the market is declining. But this doesn't seem to make sense... if the market is declining, then shorting stocks that are weaker (using the CAPM) will basically mean you are shorting stock that will fall less compared to the market as a whole.

I think I'm missing something here...


Magnus
 
Cheers Glenn...

Glenn has kindly pointed out to me a previous thread here where a few of you were essentially discussing the same stuff I have just posted about, namely CAPM...

My previous post about 'missing something' in the valuation of stocks with regard to using CAPM seems to be where the majority were also stumped...

It's great that Iraj has given us a list of strong and weak stock to trade... but I personally would feel more confident knowing how to determine, or at least how to go about determining, the value of a stock and how relatively strong or weak it is.

Some more research I think...


Magnus
 
Top