Well... Not exactly. I'm not trading off a daily timeframe but the same principles as on an intraday chart apply to a chart of a bigger timeframe. For this purpose it doesn't matter.
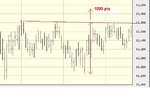
When we moved lower a good 500 points in January on a single day, the downtrend was accelerating. This was accompagnied by ever increasing volume, ending into a panic exhaust move (capitulation). A long entry could be taken here on the day the market bounced an equal 500 points to close above the high from the previous day. I've drawn a red circle around these two days. I'm not saying I'm advocating this kind of entry, what one does with it is entirely up to his own preferences with regards to risk and patience. If this was an intraday chart I'm sure some traders would go long there. With the initial target resistance around 12800 (green line) and a first exit at "1".
You are right there was a re-test - there usually is - in March, but it didn't move below the lows of January. So anyone still holding some of his position would not be stopped out. Ofcourse at "2" the trader would have noticed that price failed to break higher again and should've exited his longs to wait and stand aside to see what happens next or go short again).
At "3" and "4" we had re-tests and this confirms a potential double bottom. Although a double bottom changes the trend and often means a trend reversal, if you look at a weekly chart it's easy to see this consolidation still hasn't broken a tentative trendline drawn from the highs in October last year (see second chart). In fact, notice how the last four days we are hugging that trendline but staying below it.
Also, "5" is a sign of weakness... if the market was really strong I would expect to see it stay above the cyan demandline.
True, but the longer one waits for confirmation, the higher the risk. We are already +1000 points above the lows.
I agree, IF there will a break-out it most likely will go accompanied with a decent energy release.
Anyway, I just wanted to illustrate that there are still technical signs that support the downside view 🙂
My compliments on taking a short position as early as September though, that was a very good call.
Hi
I think the case you are putting forward is rather weak and all after EVENT analysis, which basically means WE SEEN WHAT HAPPEND NOW LETS FIND A REASON FOR IT ,
NO ONE SHOULD HAVE GONE LONG IN JAN ,, That would have been NONE TECHNICAL and BOTTOM FISHING , I am not talking about intra day trading. I am talking about swing of 3 month which if we had taken the RISK in JAN still would have made NO MONEY by MARCH since the LOW was tested again ,, SO your JAN case is well out of window. It is no good to bring the time frame into it IT SIMPLY WENT TO TEST THE LOW in MARCH as simple as that .
Now lets look at My LONG case. I have no crystal ball ,, As a Technician I need some kind of evidence to confirm CHANGE of trend. It is my responsibility to assess risk against possible reward , the technical analysis must confirm fundamental analysis of the market for the next 3 month . I need to see a new and young trend to be born before I can go long . This is principle of confirmation .. If you don't use this principle you are guessing, I need to confirm it technically and and fundamentally ,,
Technically :--
We had re test of JAN in 10 th of march ( confirmation )
We have a nice up trend regression channel on LOWER time frame ( daily ) confirmed by a OS situation in monthly ,, This is Multi time frame analysis ( second confirmation )
Fundamentally:-
ALL above explained in the first post
I went long 17Th April with INDU @ 12563, I think this was an excellent ENRTY technically but a poor entry for a man with crystal ball . Remember I am LONG when there are still DOOM and GLOOM all over the market and you telling me why I did not go long IN JAN lol you kidding me.. In JAN we had blood bath , VIX was at its highest ( currently low) . There was a talk of market crash , Bernanke was in tears and you telling me I could have gone LONG IN JAN ,,, Full time traders understand where I come from .
You see my friend.. I think you have forgotten what we went through in JAN and in what manner Bernake stopped the market from crashing and you wanted me to go LONG then,, No more comment from me .
Grey1