The aim of this article is to explain how the option premium of an ITM long call changes as the underlying moves on the price chart. There will be three points in time that we will examine.
We will use DIA, the Dow Jones Industrial Average Exchange Traded Fund, for our example. At the first point in time that we will use, the Dow was trading at 126.50 and a one step in the money long August call was selected.
We will use DIA, the Dow Jones Industrial Average Exchange Traded Fund, for our example. At the first point in time that we will use, the Dow was trading at 126.50 and a one step in the money long August call was selected.
PART I: Friday close 07/08/2011
On July 8th, after the Dow (and the DIA) had been in a strong uptrend for a number of days, it became evident where the next area of resistance would be – at the 127 level. Figure 1 shows the daily chart of the DIA creating, at that time, a formation that seems like a Bull Flag.
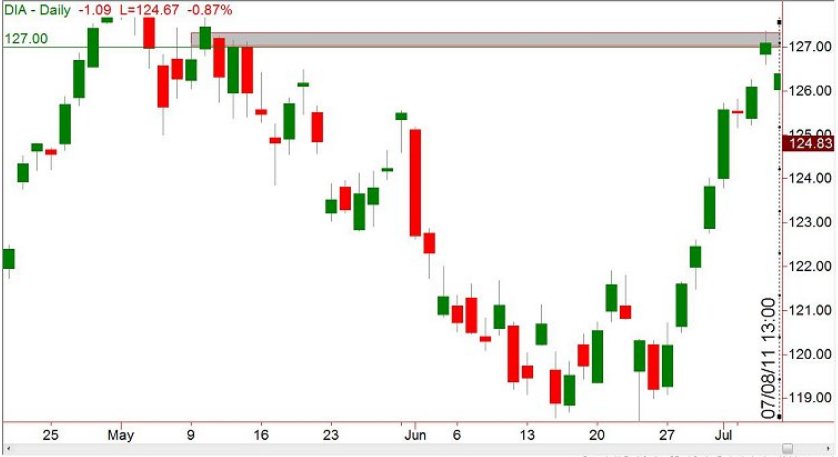
Figure 1: Daily Chart of the DIA
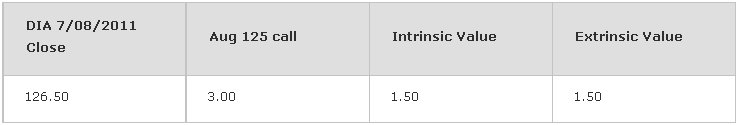
The flag pole of the Bull Flag had formed since the June 27 rally initiated. After seven days of a strong upward move with only one day of pause (the small doji), the DIA ran into the supply zone around 127 and pulled back. The question became, how much would the DIA retrace before making an attempt for another leg higher? On that Friday close, the DIA was at 126.50 and the call premium for the August 125 call, which had an intrinsic value of 1.50, was 3.00. From this moment on, we will observe what took place with the Aug 125 call as the DIA moved up and down.
PART II: Tuesday close 07/19/2011
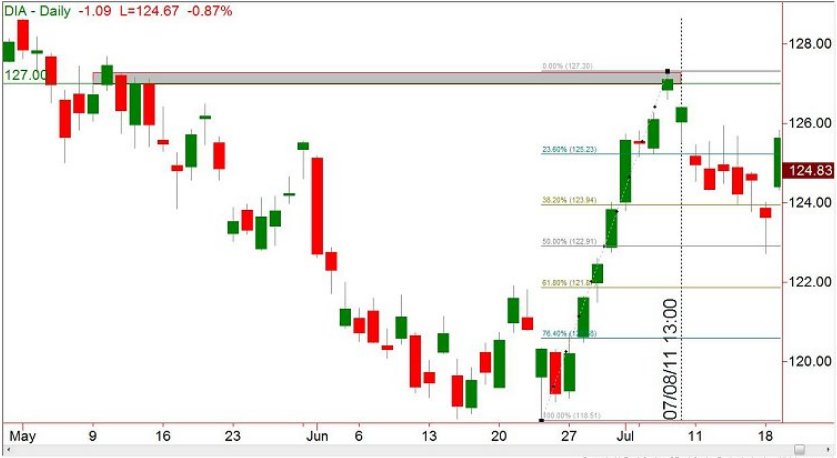
Figure 2
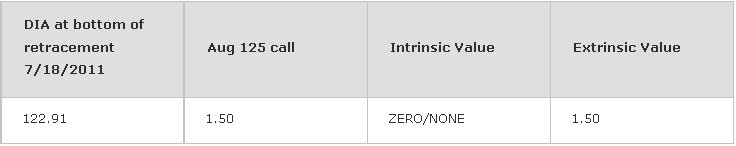
Figure 2 shows the DIA retracement being completed on July 18 at the 50th percentile. For those unsure of the measurement reasoning, let me explain that I have attached Fibonacci levels to the lowest point, which was created on June 25 to the highest point, July 7. The 50% Fibonacci was right in the middle around the 123 zone. To be exact, Figure 2 shows the reading for the Fib 50% at 122.91, and since that level, the DIA has again lifted. At those levels, the Aug 125 call would have lost all its intrinsic value and the entire premium would only be composed of fluff. The premium at those low levels was around 1.50, which was the time value or extrinsic value. At the original entry price of 3.00, half the premium was true (intrinsic) value while the other half was fluff.
PART III: Tuesday close 07/26/2011
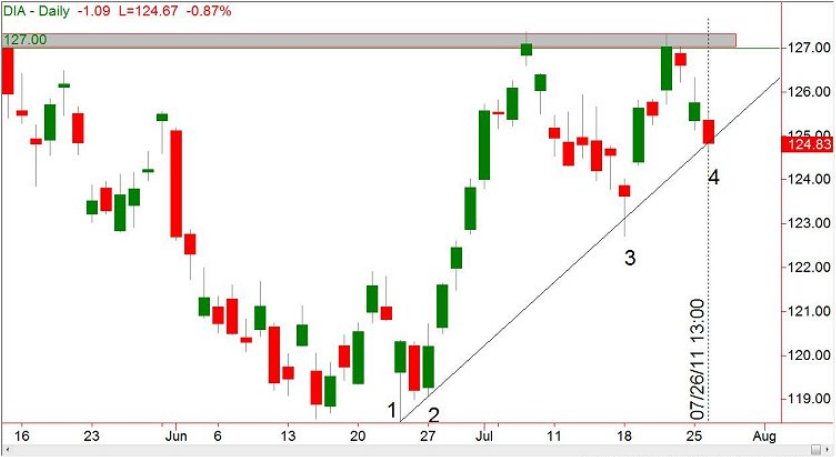
Figure 3
Figure 3 shows the DIA hitting the same supply zone at 127 again and then once again, failing to break through it. However, what is interesting, technically speaking, is that the DIA is stuck in an Ascending Triangle. Figure 3 also shows the diagonal trendline which has four touches, the fourth touch being formed on July 26th. With the DIA sitting at 124.83, the long Aug 125 call once again lost its intrinsic value and is completely composed of fluff.
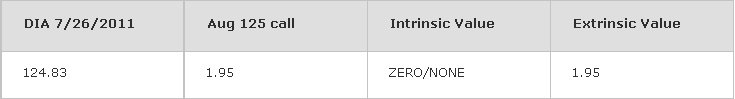
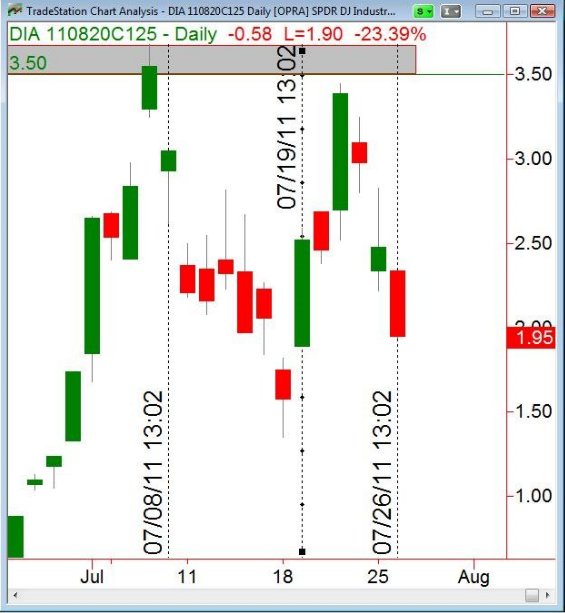
Figure 4
Figure 4 shows the daily price chart of the Aug 125 call premium with vertical lines indicating the three dates analyzed in this article. Notice how the premium value has decreased and increased proportionately depending on what the DIA was doing at the time.
This last figure below shows the two charts side by side. The one on the left is of the DIA and close examination shows the gray zone of the support at 127 being touched twice. The right chart is the same as Figure 4, the chart of the actual Aug 125 call premium so that we can compare its gray zone with the DIA gray zone. Do you notice anything different?
This last figure below shows the two charts side by side. The one on the left is of the DIA and close examination shows the gray zone of the support at 127 being touched twice. The right chart is the same as Figure 4, the chart of the actual Aug 125 call premium so that we can compare its gray zone with the DIA gray zone. Do you notice anything different?
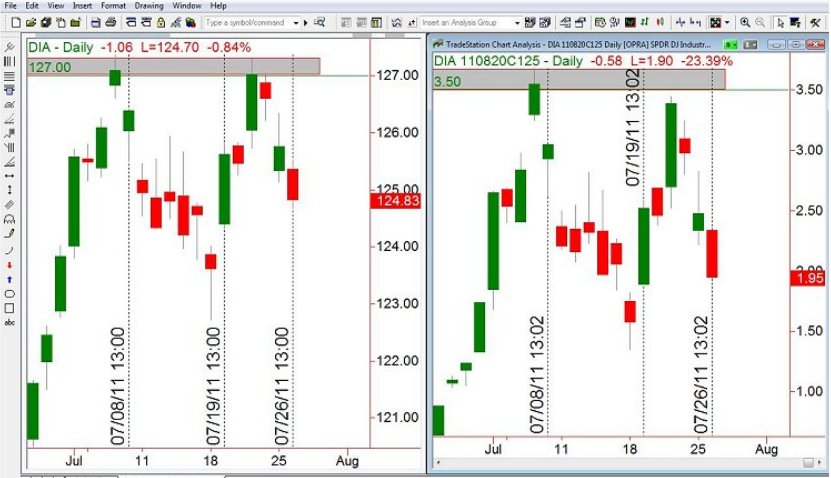
Figure 5
Hopefully, you were able to observe that the Aug 125 calls never created exactly the same high as the DIA did. There were not two exact touches. There could be a couple of reasons for this; there is the possibility that the discrepancy is due to Theta (time decay). The other reason is that the Aug 125 might have been quoted at the 3.50 level, but no trades actually executed at that exact price.
In conclusion, this article pointed out how a long call is positively correlated with the underlying stock. When the DIA went up, the long ITM call increased in value. By the same means, the opposite was true. While the DIA was in a downtrend, the long ITM call first became ATM and then even OTM as the DIA traveled lower. In the days the DIA rallied, so did the long call, gaining back its intrinsic value. In short, when trading options, keep your eyes on the intrinsic value at all times.
In conclusion, this article pointed out how a long call is positively correlated with the underlying stock. When the DIA went up, the long ITM call increased in value. By the same means, the opposite was true. While the DIA was in a downtrend, the long ITM call first became ATM and then even OTM as the DIA traveled lower. In the days the DIA rallied, so did the long call, gaining back its intrinsic value. In short, when trading options, keep your eyes on the intrinsic value at all times.
Last edited by a moderator: