What factors would you scan for a stock that is consolidating & awaiting a breakout?

Just a trade I done today - Breakout trade here

Please give me your opinions :) Its ok if its negative as I have already got into the trade :) on my own decision.

Forgot to add the stop in the picture - Stop at Previous Day Low and will trail stop up when there is a swing low
 

Attachments

  • accord.jpg
    accord.jpg
    122.7 KB · Views: 300
babymush,

However, just to make it clear, I would like to filter out among THOUSANDS of stocks so that I can eyeball the left overs easier for breakouts targets instead of monitering THOUSANDS of stocks everyday.

There are a number of online scanners that may help with this for example www.ta-ngo.com may be able to do this and I know that Prosuite2000i would also allow this to be done.


Paul
 
Itv

getting rather interested in ITV here. Downsides: NOT the most clearly chiselled case + Target/Stoploss ratio is only 2:1 or so. Hoewever me thinks shud be good for a 4-5% punt.
 

Attachments

  • ITV3months.JPG
    ITV3months.JPG
    173.5 KB · Views: 315
  • ITV5days.JPG
    ITV5days.JPG
    230.7 KB · Views: 293
babymush said:
and volume? :)

No - surprised?

When I am looking for consolidations, the breakout hasn't happened yet, so I am only looking at the price movement.

Others may take volume into consideration whilst scanning for consolidations, but I only look at the price - the actual breakout is something else and volume can come into play there.

To Clarify

I trade intraday mostly, so when I am looking for breakouts, I am actually looking for consolidations etc that could turn into breakouts, when a stock actually breaks, I don't want to be messing about scanning other carts etc, I want to see the potential trade before it happens and plan my entry, exit and stop strategies before I have to hit that trade button / hot key.

I am personally more comfortable when I know what is happening and how I will manage the trade.
 
Last edited:
China,
In the chart above, I notice your volume bars are multi-colored, with the lables being buy, sell, unknown. Whats that all about? Since each trade requires a buyer and a seller, how can the buy volume be larger or smaller than the sell volume on any given bar?

Is it just arbitrary? Like if its a down bar, then its sell volume? Is it still sell volume if a down bar happens right after and above an up bar?
JO
 
Saucers, Retests & Liquidity

Liquidity
One other thing for you to consider BM is what sort of stocks you want to trade.

The lower liquidity stocks will more likely exhibit consolidation periods than will highly traded stocks. Do other traders agree? There is a risk obviously with trading such stocks.

Retests
When prices do break out of consolidation they will often retest the BO level. Not only does this offer confirmation of the BO - when they take off from that level for the 2nd time - it also gives an opportunity to get on board potentially at a better price. The initial BO is generally more explosive (not always on higher volume).

Saucers
If you're into building a scanner profile for consolidations - Saucers are worth consideration too. They also have the advantage of potentially indicating eventual BO direction.
 
JumpOff said:
China,
In the chart above, I notice your volume bars are multi-colored, with the lables being buy, sell, unknown. Whats that all about? Since each trade requires a buyer and a seller, how can the buy volume be larger or smaller than the sell volume on any given bar?

Is it just arbitrary? Like if its a down bar, then its sell volume? Is it still sell volume if a down bar happens right after and above an up bar?
JO

It is not arbitrary - and i think this is actually one of the major advantages of ADVFN charting. Again, pls do not ask me how thry get that data - I am not associated with ADVFN in any way -but their split of volume makes perfect sense to me.

imagine MMs sit quote bid X with 1000 shares and ask Y with 2000 shares. If someone comes in and lifts the offer (MM is selling) it is a buy volume - if another lad hits the bid for 1000 (MM is buying) it is a sell volume.

Makes perfect sense to me. I am still testing ADVFN to see if what I think is correct but so far I have ni doubts that this is exactly what it is.
 
jumpoff/china

They aggregate each individual deal as it is reported (which can be delayed of course). If the deal is struck at or close to the bid/offer it is recorded as sell/buy volume as appropriate and if it's in mid range twixt bid and offer it's recorded as unknown, as are the special deals reported.

I'm not sure how they deal with delayed reporting (which has always been regarded as the curse for using intraday volume in the London market} but I think it ticks up at the time it's reported and not the time when the deal was struck (to do otherwise would result in constant re-adjustment of past volume bars).

Is that right?

good trading

jon
 
TheBramble said:
Liquidity
One other thing for you to consider BM is what sort of stocks you want to trade.

The lower liquidity stocks will more likely exhibit consolidation periods than will highly traded stocks. Do other traders agree? There is a risk obviously with trading such stocks.

Retests
When prices do break out of consolidation they will often retest the BO level. Not only does this offer confirmation of the BO - when they take off from that level for the 2nd time - it also gives an opportunity to get on board potentially at a better price. The initial BO is generally more explosive (not always on higher volume).

Saucers
If you're into building a scanner profile for consolidations - Saucers are worth consideration too. They also have the advantage of potentially indicating eventual BO direction.

Hi Bramble,

Thank you for those ideas. Regarding the liquidity issue, don't stocks move between periods of High liquidity and Low Liquidity?

When a stock has a BO, it will move into a period of High Liquidity right? Due to the increase in price attracting more people into the trade.
 
babymush said:
Regarding the liquidity issue, don't stocks move between periods of High liquidity and Low Liquidity?
Some do, some of the time. I haven't ever considered it to be a cyclical thing, but it may be. If others have done research on this issue perhaps they could let us know.

babymush said:
When a stock has a BO, it will move into a period of High Liquidity right? Due to the increase in price attracting more people into the trade.
BO wont always be on high volume. The word gets out, but if the supply is low, the price will head up without much volume. (Converse for a break down).
 
barjon - that's right, ADVFN record trades when they're reported and guesses buy/sell based on the price in relation to the bid/offer. For delayed trades it's worse than useless because it may as well be random, and they're the bigger ones.

As for every sell matching a buy and vice versa, how literally should you take this for individual stocks, where the market makers act as a buffer holding stock? Unlike futures you can have a net selling day or a net buying day can't you?
 
china white said:
imagine MMs sit quote bid X with 1000 shares and ask Y with 2000 shares. If someone comes in and lifts the offer (MM is selling) it is a buy volume - if another lad hits the bid for 1000 (MM is buying) it is a sell volume..

That does make sense. Thanks for the clarification.
JO
 
china white said:
It is not arbitrary - and i think this is actually one of the major advantages of ADVFN charting. Again, pls do not ask me how thry get that data - I am not associated with ADVFN in any way -but their split of volume makes perfect sense to me.

Makes perfect sense to me. I am still testing ADVFN to see if what I think is correct but so far I have ni doubts that this is exactly what it is.

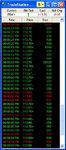
If you look at a Time & Sales cart you can see the sales and purchases in colour as they happen. Red for sales, Green for purchases. (Screen shot below)

I believe this is how it works (but I could be wrong)...

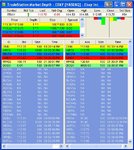
My explanation is based on a Nasdaq level 2 chart, as this is how I understand it and can explain it. A screen shot of my L2 screen is below, there is not so much activity as the market was closed when I took the shot.

Some people who want to buy a stock at a price will put their 'bid' into the market at the price they are willing to pay, if you are an ordinary person, then your bid will go in via an ECN and sit on the level 2 screen (left side of the L2 screen).

If you hold shares and wish to sell them at a particular price, then you can submit your 'ask' or 'offer' of sale on the right hand side of the level 2 screen.

The prices on the L2 are ordered by the cheapest at the top.

The very top prices are what you see on many software packages as the current bid and ask - also known as the 'yellow strip' price.

Most individuals though, buy at the 'market' price, ie. they by from the people who are selling on the level 2 screen. These purchases show up as Green on the Time and sales, they are people actively trying to purchase a stock now - this is purchase volume.

Someone trying to sell stock at 'market' price, sells to someone on the bid side of the L2 screen - this registers as selling volume (Red).

I believe that the colour coded volume you see on CW's chart is based on these figures, look at the Time and sales screen shot, you see mostly people actively purchasing at this point (Green prints) and you can see how many shares were transacted each time.

There are reasons why the trades 'at market' are counted as pressure (Buy or Sell volume), such as...

If no-one wanted to sell, those on the bid side of the screen just wouldn't be doing any business, they need someone to actively wish to sell to them for a transaction to be made and Vice versa.

Corrections or clarification on this are welcome.
 

Attachments

  • Time&Sales.jpg
    Time&Sales.jpg
    44.7 KB · Views: 202
  • Level2.jpg
    Level2.jpg
    78 KB · Views: 239
Last edited:
Level II is useful for determining market entry on any intra-day setup whether a breakout or otherwise.


Paul
 
babymush,
Yes, imo, level2 is a great help in determining whether a price will hold, rise or fall at any level, but my own use of it in conjunction with several other factors keeps me out of many breakouts which then fail. Equally that micro analysis points to successful break outs. Nothing is totally infallible, but this means I take fewer trades but with a higher success rate.
Level2 is like a microscope, an indispensable tool but not some magic wand. It is not easy to learn as there are many subtleties to its use - and it has several uses.
It is also a skill which grows with use and experience. I very often find I enter trades before the move appears on a chart or volume bar - and I frequently exit a trade at or before it turns against me. My own use of level2 is integrated with other factors and is essential to my trading.
Level2 is about faking MMs, buying and selling pressures, behaviour of market participants at different levels and how and when that behaviour changes.
Between the above comments and ardhill's helpful post, you might get a glimpse of what it's all about.
The person on these boards who I think is a great level 2 trader is Naz and you should also read what he writes.
Richard
 
Top