What factors would you scan for a stock that is consolidating & awaiting a breakout?

babymush

Active member
Messages
221
Likes
1
What factors would you scan for a stock that is consolidating & awaiting a breakout?

Hi

What scans would you do to do a breakout play?

What factors would you use like Low volume - Small range in the past 5 days to scan for stocks that are consolidating after a recent upmove and may breakout soon? :)
 
Low volume is not necessary but a constant volume is a good sign along with narrow intra-day range. Once volume starts picking up and price starts closing near the high (or low for Short trades), get ready for the break.


Paul
 
But won't Constant volume show that many shares are exchanging hands - What does a consolidation do in the first place?

Is it for the stock to exchange hands from the "weak" hands to the "strong" hands

by weak I mean those people that are looking to profit take as they are in a profit position from the previous climb
 
Bollies are based on Volatility. (OK - X SDs from an MA of choice). So you could have a BB tightening (on decreasing volatility), but be in a trend - not a consolidation.

The easiest way to check for consolidation from a scanner would be for it to determine a flat short-term (say 5 period) MA on the High and the Low.
 
Last edited:
Agreed. Bollinger Bands can tighten on reduced volatility with no consolidation and are therefore not an indicator for what you're seeking. If you do an SMA-4 (or EMA-4 - not much difference) of the high and an SMA-4 (or EMA) of the low (or 5 rather than 4 as the Brambly one suggests above) this will help: you can easily see if they're parallel. You can see fairly easily just from watching the price bars anyway, though; no?
 
Roberto said:
You can see fairly easily just from watching the price bars anyway, though; no?
That's what I do as well Roberto. But BM was looking for a 'scanner friendly' solution.

Although it's a fairly simple scenario to code into any decent charting package (TS/MetaStock) - I'm not sure too many internet-based scanners (Prophet, QT etc.) could handle it.
 
My Trade Seeker software has a "Consolidation- Breakout" watch list that I harvest prospects from.

On swing-highs I personally like to see a five day (or so) sideways consolidation with similar highs and lows throughout. Ideally volume decreases and the lows start to get higher. If my trading capital is not maxed out I'll set a trap above the base's highest point and wait (GTC). However if settled funds aren't plentiful, I'll simply set alarms alerting me when the base does break its highest point (with volume). Fun-fun!

d-
 
TheBramble said:
That's what I do as well Roberto. But BM was looking for a 'scanner friendly' solution.

Although it's a fairly simple scenario to code into any decent charting package (TS/MetaStock) - I'm not sure too many internet-based scanners (Prophet, QT etc.) could handle it.


Hi Guys thanks for that :)
Coding for MA high and MA low flat should be quite simple on Metastock :) (which I am using)

however, just as a learning process, what is the idea being behind MA high and MA low being flat would mean that a stock is in consolidation?

Also don't quite catch the part about Bollinger Bands tightening (why may it not mean that a stock is in consolidation?)
 
des44 said:
My Trade Seeker software has a "Consolidation- Breakout" watch list that I harvest prospects from.

On swing-highs I personally like to see a five day (or so) sideways consolidation with similar highs and lows throughout. Ideally volume decreases and the lows start to get higher. If my trading capital is not maxed out I'll set a trap above the base's highest point and wait (GTC). However if settled funds aren't plentiful, I'll simply set alarms alerting me when the base does break its highest point (with volume). Fun-fun!

d-

Wow, must think of a way to scan for that ;p but des from your videos, I mainly see that the BO you trades seems to be having a swing high, Pullback and a Break Above the previous swing High - Does a stock have to be moving sideways for a period before it gets into your list of potential BO targets?
 
babymush said:
Wow, must think of a way to scan for that ;p but des from your videos, I mainly see that the BO you trades seems to be having a swing high, Pullback and a Break Above the previous swing High - Does a stock have to be moving sideways for a period before it gets into your list of potential BO targets?

Absolutely not. A true breakout is one that consolidates for a number of days and one day the price jumps significantly fuelled by volume. Most of my videos so far are those simply trending--making new swing-highs. You'll catch me sometimes using the terminology "break out" to signify newer highs. Maybe I need to get over my laziness and call things what they are--"This stock broke minor resistance making for a new high."
;)

d-
 
To scan for a consolidation, could you not just calculate (High + Low )/2 for so many bars back and set a percentage variation that you would be happy with, say 0.1% of the stock price

So, on a $40 stock, if the (High+Low)/2 for 5 bars back was within a 0.1% fluctuation, then it would trigger a look see?

Just a thought as I am reading this, so it could well be wrong. Any corrections to this are welcome.

For those of you calculating, the 0.1% would be a possible variation on 5 minute bars, but you may need to vary that a bit for different bar periods. I think you might be a little tight for daily bars ;) with that percentage.

I also believe that Pristine's ESP scanner scans for consolidations on 15 min bars, I had a free trial of it a while back and seem to remember it doing this.
 
ardhill said:
To scan for a consolidation, could you not just calculate (High + Low )/2 for so many bars back and set a percentage variation that you would be happy with, say 0.1% of the stock price.
I don't think that would work.

High+Low in a trend, but with relatively constant daily range would provide a flat resultant value - but you'd still be in a trend - not a consolidation.

edit: Of course that would work! (slap!) I was reading it as High - Low - which would just yield a daily range independent of actual price level...doh!

babymush said:
Also don't quite catch the part about Bollinger Bands tightening (why may it not mean that a stock is in consolidation?)
Because Bollinger measure VOLATILITY.

Don't forget as you code this BM to take on board Trader333's comments -

"Once volume starts picking up and price starts closing near the high (or low for Short trades), get ready for the break."

Adds a great deal more complexity to your coding, but will get you ready ahead of the break (potentially) rather than after it happens.
 
Last edited:
example

very good thread.

let me contribute a bit with a live example.

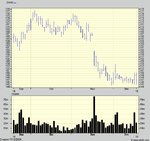
Dixies. Do u think it is an Adam&Eve's bottom forming and the paper is going to rock'n'roll? If u answer yes to this Q, what is your view on the last 2 sessions - attempted b/o on increased volume and then price recoiling back on half volume? :)
 

Attachments

  • DXNS.JPG
    DXNS.JPG
    201.7 KB · Views: 400
Is this a play in your opinion?

d-

china white said:
very good thread.

let me contribute a bit with a live example.

Dixies. Do u think it is an Adam&Eve's bottom forming and the paper is going to rock'n'roll? If u answer yes to this Q, what is your view on the last 2 sessions - attempted b/o on increased volume and then price recoiling back on half volume? :)
 
Is there a triple witching day for UK stocks?

Sorry, I really don't know. In the US, it was Friday and the market was not behaving as it should on a 'normal' day, that could explain the gap down and the low volume. I assume that the last session on the chart was Friday 17th, it looks like Saturday 18th - though I'm not sure how it could be, being that the markets where closed and the chart was created on Friday and all :)

Also the price has been trending down for the last month and a half that we can see on the chart. It has made a couple of attempts to break to the upside, but not made it. I am sure there would be a much less risky trade for an upward breakout on the UK market than that.

I know that the price has started to flatten, but does this indicate a possible upside move - too much guess work and speculation for me. I like Livermore's ideal of trading with the line of least resistance. Least resistance here is downward and if anything, I might put a stop market order under the consolidation to short it.

Or was this a trick question China?
 
given last 2 bars - not yet. MMs have obviously stabilised the share after the wash out and there may be potential for a long punt. But I really want to see A&E bottom to confirm. I'd say it'll be clear in a week's time or so. Do not forget it is a retailer - and Xmas is their crucial time of the year.

Last bar was really bad for going long here - really bad.
 
ardhill said:
.....Or was this a trick question China?

yes a bit :) your short idea is actually very good on the b/d. The funny thing about such patterns is that no matter whether u r long or short u have a very natural and quite tight stop loss :)
 
1 quick question to everyone -

Does indicators affect your decision in a Breakout Trade?

MACD, CCI, ROC or Stoch?

Would a indicator being overbought when it breakouts put you off or is that what is necessary in order for you to enter the trade?
 
des44 said:
Absolutely not. A true breakout is one that consolidates for a number of days and one day the price jumps significantly fuelled by volume. Most of my videos so far are those simply trending--making new swing-highs. You'll catch me sometimes using the terminology "break out" to signify newer highs. Maybe I need to get over my laziness and call things what they are--"This stock broke minor resistance making for a new high."
;)

d-

Hehe ok :) Understand now - Just 1 question currently, You usually put a Buy Stop just above the previous swing high - Why not put a buy stop at the high of the PREVIOUS BAR HIGH instead as it will catch the up move faster ? :)
 
Top