be-positive
Veteren member
- Messages
- 4,969
- Likes
- 488
not looking good stop is at -10
afternoon ,
just curious petar ---you say (Keep in mind the trend is very important. Without trend, you have less chance to succeed.) so why was your first trade on this gbp/usd a short?
could this be gbp/usd heading northbound again here at (2.25pm --14/15 area?)
not looking good stop is at -10
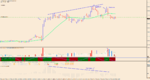
Hey, nice post btw. You bought the top of the value area, it seems. Not much movement at that level normally. It wasn't the best call, I really hope you got your high but the F period print which was my J period was a failed range extension due to long-term responsive buyer, that said the volume was likely more short-term than long-term so looks like a neutral day, so I would expect a failed range extension to the upside or at best a stall due to the lack of long-term volume. Today I would suspect a value trade presents itself and the market would likely trade short.Hello traders,
I will start to post-market auction analysis (Market profile) together with volume price action.
The Market Profile is a dynamic, real-time database that records, organizes, and displays the market’s evolving auction process. Its primary benefit rests in its unique ability to facilitate the interpretation of market-generated information.
The foundational building blocks of the Market Profile are time, price, and volume. When these building blocks are displayed within a Market Profile graphic, traders experienced with the Market Profile are, in most cases, able to identify developing balance and imbalance in the market’s structure. Interpreting the probability of change frequently provides the trader an undeniable edge in identifying potential opportunities.
Basic >
Every letter represents 30M period and this analysis is also called Auction analysis. What I do rly. like in this type of analysis is TIME factor. In my opinion, TIME is the very important factor and it tells you a lot of things to understand market behavior.
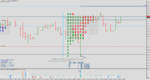
I am posting you my AUD/USD active position. I took long at 0.7206. I did analysis on today market structure and I found buying tail - single prints F in this example (responsive buyers from the big boys). Time told me that buyers are in big control today and that higher prices are very possible.
Sl is around 25 pips and I will try to take about 75 pips. Anyway, will fallow market structure if I need to close manually.
From Volume spread analysis prospective I found reversal up-thrust in an ultra high volume, which is a good sign that we got conditions for a higher price.
If you like my analysis, feel free to comment >
Petar
we'll just have to agree to disagree. i've been trading for years, and have studied thousands of chart patterns at this point.
too often the expanding volume does not come until after the breakout.
aside from some trend analysis, just give me price and a breadth indicator, particularly when daytrading, since you simply don't have time for lengthy analysis.
the last thing i want to do is overanalyze, and miss trades. i'd just soon get a few wrong, and let my winners make up for it.
on the longer term charts, i spend a little more time looking at the underlying components, ie apple, msft, sox, etc.,to find confirmation.
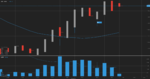
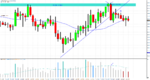
notice the two W bottoms below and corresponding volume at breakout. you'd have missed the boat on both.
cheers

Hello there and welcome to the thread 🙂
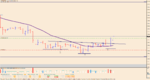
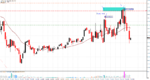
On the GBP/USD, we got very choppy market today and low liquidity. Probably smart money awaiting Manufacturing Production m/m. This news can bring us liquidity so I will carefully watch price action tomorrow. Again, when i daytrade i trade after the high impact news and observe price action and volume. If I do trade regular market there must be some chart pattern together with volume.
Best Regards,
Petar
Hey, nice post btw. You bought the top of the value area, it seems. Not much movement at that level normally. It wasn't the best call, I really hope you got your high but the F period print which was my J period was a failed range extension due to long-term responsive buyer, that said the volume was likely more short-term than long-term so looks like a neutral day, so I would expect a failed range extension to the upside or at best a stall due to the lack of long-term volume. Today I would suspect a value trade presents itself and the market would likely trade short.
I am primarily a Vanilla Options trader, so the profile is immensely helpful but I don't need stops so my life is way easier. That said I use to trade interbank Options for years, so the profile is second nature to me. The key is figuring at what kind of day it will be, if you know that then getting they trade off is fairly straight forward. Of course with no volatility to worry about in Options, your chances improve immensely.
Nice post on MP.
James you seem to be implying that the visible BUYING volume is the fuel of the upside breakout ?
What about the massive SHORT volume that accumulated before the "break"
What do all those Shorts do as price starts going against them ?
Not trying to be a smartass, you're obviously very comfortable where you are,
but I would urge anyone else to look at the Jigsaw tools, and the lessons on understanding volume and the role it plays.
I don't understand, generally, the obsession with Forex trading
but for someone like you, who (correctly) identifies Volume as a key component of the trading decision, I am really baffled why you persevere with Forex, rather than trading 6E and 6B futures themselves ?
I know Forex brokers make it easy to get up and running (with good reason), I'd hate to think it were just laziness or complacency on the part of anyone who doesn't make the switch to Futures ?
James you seem to be implying that the visible BUYING volume is the fuel of the upside breakout ?
What about the massive SHORT volume that accumulated before the "break"
What do all those Shorts do as price starts going against them ?
Not trying to be a smartass, you're obviously very comfortable where you are,
but I would urge anyone else to look at the Jigsaw tools, and the lessons on understanding volume and the role it plays.
massive short volume? which pattern are you referring to? and how do you know its short volume?
Hello traders,
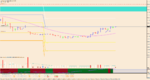
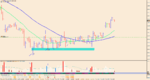
I saw weakness on EUR/NZD. There is support cluster near the level of 1.6370. I saw few down bars in a high volume but with weak close (in the middle), which is a sign of strength. I also found successful testing of supply in a low volume. The daily bar also closed in the middle. I bought near the level of 1.6415 and secured already.
Petar
Someone should create an indicator that collects the trading volume from the biggest brokers and combine them together - although even then it wouldn't give a really good estimation of the real trading volume.