Vetex FX VTL Indicators & Scripts

FireBird

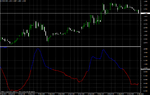
Firebird is an indicator to identify the price spikes in the market. Firebird indicator first calculates a 10-period moving average, then shifts this moving average a certain percentage above and below the 10-period moving average. The shifted averages are drawn on chart as the red and green line. When price touches these lines, price spike is identified. Usually after a price spike, the trend reverses for some time. The indicator can be used to take advantage of this price behaviors. In daily chart usually the 10 period MA is shifted by 2 percent to form the price bands. On lower time frames like Hourly, Four Hour a smaller percentage price shift is used like 0.5% . The important consideration here is most of the price bars must be contained within the upper and lower bands.
When price reaches above the upper red band, a sell position is opened. When price reaches the lower green band, buy position is opened. Trades can be managed with proper stop loss and take profit. In the picture, Firebird indicator is attached to daily chart of EUR/USD with 2% shift on MA. Note that almost all price bars are within the price bands. And when price extends beyond these bands, price trend reverses and comes back into the bands.
URL]]
 

Attachments

  • FireBird.zip
    1.8 KB · Views: 245
FLAT TREND

Flat Trend Indicator identifies the prevailing trend in the chart. It plots a green histogram when the price is in an uptrend, in a downtrend it plots the red histogram and in sideways markets it plots a yellow histogram. With this indicator applied on the chart, trend identification can be easily done by looking at the indicator panel. The trend is identified by combining Parabolic stop and reverse indicator (PSAR) and ADX indicator. When PSAR is in buy mode and ADX is showing an uptrend, the trend is marked as up. When PSAR is in sell mode and ADX is showing downtrend, the trend is marked as down. All other situations are marked as a neutral trend. This indicator is useful to identify the prevailing trend in the market and traders can tune their system to take positions in the trend direction. Discretionary traders can use it to align their position in the trend direction. The RSI indicator is used to identify the overbought oversold situation in the market. However, in trending markets, going short when RSI indicates an overbought situation is not a good trade. With this Flat trend indicator, if the trend is flat and RSI reaches overbought, levels, opening a sell position has better chances of winning. Many traditional indicators performance can be improved by using Flat Trend indicator as a trade filter.

kf5ndf.png
 

Attachments

  • Flat Trend.zip
    1.9 KB · Views: 277
RSL

Levy’s Relative Strength Indicator (RSL) is used to identify the instruments showing strength and weakness. The concept of Relative Strength to Levy is based on the assumption that securities which exhibited a large relative strength in the past will also develop relatively strongly in the future, and conversely. RSL is used to create balanced long-short portfolios in trading portfolios. For Currency traders, RSL can be used to pick the currency pairs showing the highest strength and weakness. Traders create a portfolio of positions by buying stronger instruments and selling the weaker instruments.
The first step in creating a long-short portfolio is ranking all instruments based on their strength and weakness. Note down the RSL value of each currency pair at the start of the week or month. The pair that has the highest RSL value is the strongest one. The pair that has the lowest RSL value is the weakest one. Now open Buy positions on the top two stronger pairs and open sell positions on top two weaker pairs. Keep the positions open for the next week or month start. At the start of next week or month, again rank the instruments based on their RSL values and adjust the positions. This portfolio is hedged, market neutral and offer steady return over long periods of time.

2z71rx0.png
 

Attachments

  • RelativeStrengthLevy.zip
    1.9 KB · Views: 260
Close All On Timer
Close all On Timer is a VertexFX EA that closes all open positions and limit orders at a stipulated time. In Forex markets news releases have a high impact on price volatility. Big price moves happen when some unexpected new release comes. Economic calendars like the one at Fxstreet.com gives in advance the time of important news release. Many traders close their open positions before such important news release events. This helps in avoiding getting trapped in price moves following the event. The close all on Timer EA is developed to smoothly handle such situations.
You enter the time to close all open positions in the EA and the EA take care of all positions. At the predefined time, the EA close all positions and limit orders. You can set up the EA in the terminal and walk away while the EA waits for the time to close all positions. The close time you enter in the EA is in your computer’s local time zone. It should be entered within double quotation marks. For example, if you need to close all positions at 2:28 PM, then enter the time as “14:28:00”. Note that the time is entered in 24-hour format. If the time entered is less than the present time, EA will close the positions the next day at that time. You can leave the positions open at night and close it in the wee hours while you are sleeping with this EA.

snghf8.jpg
 

Attachments

  • CloseAllOnTimer.zip
    1.9 KB · Views: 242
Auto Trend Lines

Auto Trend Lines is a VTL Client-Side indicator to plot trend lines. It detects the peaks and troughs in the chart and then plot trend lines joining recent peaks for down trend line and the recent troughs for uptrend line. Trendlines are usually considered as strong support resistance levels. Traders can open buy positions when the down trend line is broken, and price remains above the trend line. Sell position can be opened when the uptrend line is broken, and price remains below the trend line.
The Auto Trend Lines VTL can be used to identify geometrical chart patterns like Triangles and Flags. Symmetrical Triangles, Ascending triangles and descending triangles can be easily identified. Up and down flags can be identified with help of this indicator. It can be used to identify many other chart patterns like trend channels, pennants etc.

yYpncHO.png
 

Attachments

  • AutoTrendLines.zip
    2 KB · Views: 222
STARC Bands

volatility.

STARC bands is used in two modes. First one is as a trend following indicator. For this enter 1.33 for parameter KATR. Now when price breaks out of the bands, there is a high probability that price move will continue in that direction. Open positions in the breakout direction.

To use STARC bands as an oversold overbought indicator, make parameter KATR 3. Now when the price reaches the bands, chances are that it is a short-term price extreme. Countertrend trades can be opened here.

Parameters:
  • MA_Period – Moving Average Period
  • ATR_Period – Average True Range Period
  • KATR – ATR multiplier
  • Shift – Number of bars to shift forward

EkiJUnh.png
 

Attachments

  • STARC Bands.zip
    2 KB · Views: 206
Previous Day High Low

Previous day high low is a Client Side VTL indicator that draws the last day’s high, low and today’s open on the chart. When day trading, the previous day’s high and low are important reference points or support resistance levels. In a bullish market price breaks above the previous day’s high early in the day and continue to trade above that level. In bear markets, price break below the previous day’s low early in the day and continue to trade below that level. Trading ranges form when price fails to break the previous day’s high or low successfully. This info alone can improve your trading results as this give you a clear vision of what is likely to happen today.
Breakout trading strategies work best when price is above or below yesterday’s range. Trend following strategies also work best in this situation. When price is inside yesterday range, counter trend strategies work better. Oscillators like RSI and Stochastics work best in this situation.

WHUoaQb.png
 

Attachments

  • Prev_Day_High_Low.zip
    1.8 KB · Views: 234
Extend TrendLines

Extend Trend Lines is a VTL Client-side indicator for elongating the trend lines on the chart to the last bar. Traders usually draw trend lines on the chart and use them as support resistance levels. When a trend line breakout happens, it is the beginning of a new trend. One issue with trend lines drawn manually on the chart is that they do not get elongated when new bars form on the chart. It should be manually adjusted with new bars. Extend Trend Lines VTL Indicator takes care of this situation. It automatically adjusts all trend lines on the chart to the last bar. It monitors the trend lines on each new bar and adjust them. This is useful when the trader opens the terminal on a new day and the old trend lines are short and need adjustments.

Sja0KDp.png
 

Attachments

  • ExtendTrendLines.zip
    1.5 KB · Views: 212
Brain Trend 2

Brain Trend 2 Is a short term signals indicator. It is used for intraday trading. Brain Trend 2 identifies the short term trend using Williams percent R indicator and average true range. When a short term trend is confirmed by the indicator, it plots semaphores on the bar to show the trend. Bars with red boxes indicate downtrend and bars with blue boxes indicate uptrend.

When a trend is identified, open positions in the direction of the trend. When red boxes appear open short position. When blue boxes appear open long position. It is more effective when coupled with other indicators. A moving average can be used as a trend filter. Set the moving average period to medium term or long term like 50 or 100.

267634
 

Attachments

  • BrainTrend2.zip
    2.5 KB · Views: 209
Ichimoku Alert

Ichimoku Alert is based on the Ichimoku Cloud charts. This is a simplified VTL Alert based on price crossing the Kijun Sen of ichimoku chart. The Ichimoku Cloud is a type of chart used in technical analysis to display support and resistance, momentum, and trend in one view. The Ichimoku alert takes the Kijun Sen and raises an alert when price crossover happens.
fkmkpdy.png

This should be used together with an ichimoku chart or other indicators. A signal in ichimoku alert means there is a high probability that a new price wave with momentum can form. For traders using ichimoku charts, these alerts inform them that a trend change is occurring in ichimoku chart and they can switch to ichimoku chart and analyse the situation. In trading ranges, this indicator generates whipsaw signals, so always use it together with other indicators or ichimoku chart. Ichimoku Cloud indicator is available in vStore.
 

Attachments

  • Ichimoku_Alert.zip
    2.3 KB · Views: 199
Brain Trend Signal Alerts

Brain Trend Signal Alerts is Client Side VTL indicator that plots buy and sell signals. This follows the short-term trend and is a great intraday trading tool. The indicator identifies the trend changes using candle high lows and Average True Range. The red arrow appears when a down trend is identified and green arrow appear when trend changes upward.

For best results, Brain trend alerts can be used together with a long term moving average like the 200 period simple moving average. Buy signals are valid when the signal is generated above the moving average and sell signals are valid when they form below the moving average.

The indicator writes the current signal and last trade details on the information panel on chart. When a new signal appear, it raise an alert.

4jOFdtY.png
 
Daily Volatility Breakout

Daily Volatility Breakout Client Side VTL Indicator is based on the idea that when price moves strongly in one direction from the day open, that move is likely to continue further. It is based on previous day’s volatility, the high low range of previous day. It marks a buy line at 70 percent above the day open price, and a stop loss level 50 percent above the day open. When price cross above the buy line and holds above it, opening long position is advised.
The sell line is 70% below the day open and sell stop is 50% below day open. Short position is suggested when price cross below the sell line. The idea behind the indicator is that when price moves strongly in one direction from day open, the trend can continue in that direction.
YLWY8kE.png

This is a trend following indicator and positions can be kept for a few days if the trend is strong enough after breakout from the Buy sell levels. Like any other trend following indicators, it does make false signals in consolidating markets. So use Daily Volatility Breakout indicator together with other indicators to confirm the signals.
 

Attachments

  • Daily Volatility Breakout.zip
    2.4 KB · Views: 205
Qualitative Quantitative Estimation (QQE) is based on a combination of smoothed Moving Average of RSI along with the average true range ATR. Volatile assets such as forex, futures, stocks etc. can be monitored using the Qualitative Quantitative Estimation (QQE) indicator. The indicator displays two lines; a fast and a slow-moving trailing stop line. The level 50 is important in QQE indicator. When the fast line (green line) is above 50, trend is considered bullish, if it is below 50, downtrend is assumed.

The original QQE indicator trading strategy is to buy when the green line is above 50 and it cross above dotted red line. For a sell trade the green line is below 50 and green line cross below dotted red line.

268888


Some traders open Buy position when the green line is below 50 and it cross above red line. Another method is divergence between price and QQE indicator. When price makes new lows and QQE indicator’s green line fails to make new lows, buy position can be opened. When price makes New highs and QQE green line fails to make new highs, sell position can be opened.
 

Attachments

  • QQE.zip
    2.2 KB · Views: 193
Perfect Trendlines

Perfect Trend Lines, PTL, is a short-term trend trading indicator. The lines showing the trend in this indicator is not straight lines like normal trend lines. PTL indicator calculation is simple. First take the 7 bar high and low, then the 3 bar high and low. If the close price is above the 7 bar high and 3 bar high, then an uptrend is identified. When the close price is below the 7 bar low and 3 bar low then a downtrend is identified. These bars are considered as strong trend bars. The magenta line is the 7 bar high or low depending on the trend. The cyan line is the 3 bar high or low depending on trend direction. When price is trading between these 2 lines trend strength is weak.

A magenta diamond shape appears when sell signal is generated. Cyan diamond shape appears for a buy signal. The magenta line can be used as stop loss. The cyan line provides a tighter stop loss level. Strong downtrend bars are marked by a magenta dot at the bar high and strong uptrend bars are marked by a cyan dot at the bottom of the bar.
6KJg1bB.png
 

Attachments

  • PTL.zip
    2.8 KB · Views: 178
Day Channel

“Day Channel” indicator marks short term support resistance levels for intraday trading. It consists of the day’s High, Low, midpoint, and levels at 38.2% from the day high and low. Day channel is intended to use on lower time frame charts like 5 minutes, 15 minutes, etc. These levels become valid after a few hours of market open each day, best to use towards the closing session.
4fdD0Zf.png

Trading activity below the midline shows bearish sentiment for the day and above midline implies bullish sentiment. In the image, price breaks below the lower support line and trades lower. Later it consolidates between the two lower lines. The day high and low are good support resistance levels. Day channel is not a stand-alone indicator, it should be used together with price action or other indicators to confirm breakout or reversal at these levels. Candle patterns forming at these levels can be used to open trades. When a reversal candle pattern like engulfing bars, hammer, etc. form at these levels, trades can be opened.
 

Attachments

  • Day Channel.zip
    2.1 KB · Views: 174
Kase Peak Oscillator

The Kase Peak Oscillator is made of statistical observation of prices over the last KPeriod. It automatically adapts its cycle to any timeframe or instrument by using a percentile rank of what happens now in comparison of the whole distribution of past values. It consists of a histogram and a line indicating overbought oversold levels.

Buy Signal: Histogram cross above the zero level
Sell Signal: Histogram cross below the zero levels

When histogram reaches the line, chances are a reversal or consolidation may follow. However, in strong trends, the histogram may overshoot the line for may bars before slowing down. This can be used to book profits and open trades if reversal is confirmed by other indicators or price action. Like all indicators, Kase Peak Oscillator also generate whipsaws in consolidating markets.

Divergence between the histogram and price bars present good trading opportunities. When price makes new lows and the oscillator fails to make new lows, it is a divergence between the price and the oscillator. When divergence happens, there is high probability that trend reverse upward. For trend reversal down, price makes new high and oscillator fail to reach a new high.

wlL7xXF.png
 

Attachments

  • KasePeakOscillator.zip
    2.3 KB · Views: 194
VolatilityRatio VertexFX Indicator
The VolatilityRatio is a powerful VertexFX client-side indicator based Volatility and trend reversal.

Volatility is a measure of fast market movements. When volatility increases the markets are moving fast and making big ranges. However, we cannot predict the direction of the market based on the volatility. The VolatilityRatio (VR) determines the direction and the end of the trend thus providing a valuable tool to traders.

When VR is above 1 it indicates a bullish trend, and similarly when VR is below 1 it indicates bearish trend. By waiting for the bullish and bearish trends to top out and bottom out respectively traders can exit at the earliest their LONG and SHORT positions respectively.

BUY / EXIT SHORT - Enter LONG (or exit SHORT) when the Volatility Ratio is RED and bottoms out. The stop-loss can be placed below the nearest Swing Low. Use short term EMA to ensure that current price is above the EMA.
SHORT / EXIT LONG - Enter SHORT (or exit LONG) when the Volatility Ratio is BLUE and tops out. The stop-loss can be placed above the nearest Swing High. Use short term EMA to ensure that current price is below the EMA.
 

Attachments

  • volatility.png
    volatility.png
    45.9 KB · Views: 193
Simple Decycler Oscillator VertexFX Indicator


The Simple Decycler Oscillator is a powerful VertexFx client-side indicator that identifies the start and reversal of a trend.

One of the major drawbacks of conventional indicators is that the signals have lag resulting in delayed trade entries. The Simple Decycler Oscillator attempts to reduce the lag by using two oscillators.
The indicator comprises of two components, the fast oscillator identified by the BLUE line and the slow oscillator identified by the RED line. The fast component is calculated using the FAST_PERIOD and the FAST_K co-efficient. Similarly, the slow component is calculated using the SLOW_PERIOD and the SLOW_K co-efficient.
The components are calculated using cycle analysis theory. The strength of the trend is calculated using a high-pass filter over the specified period and smoothed with the smoothing co-efficient (K).
The difference between the BLUE and the RED line indicates the direction of the current trend. When the BLUE line is above the RED line the trend is considered bullish and when it is below the RED line the trend is considered bearish.

BUY / EXIT SHORT - Enter LONG (or exit SHORT) at the close of candle when the fast (BLUE) line closes above the slow (RED) line. The stop-loss can be placed below the nearest Swing Low.
SHORT / EXIT LONG - Enter SHORT (or exit LONG) at the close of candle when the fast (BLUE) line closes below the slow (RED) line. The stop-loss can be placed above the nearest Swing High.
Simple desc.png
 
MACD OSMAX VertexFX Indicator

is a powerful VertexFX client-side indicator based on the Moving Average Convergence Divergence (MACD) indicator.

The Moving Average Convergence Divergence (MACD) indicator is provides information about the current trend and its strength. When the MACD bottoms out and starts rising it implies the market is in bullish mode, whereas when it tops out and starts falling it implies that the market is in bearish mode. However, one of the drawbacks of the MACD indicator is that it introduces lag and introduces whipsaws when the market turns sideways. The primary reason for the lag is the use of Simple Moving Average (SMA) in the calculation of the MACD.
The MACD OSMAX indicator overcomes the drawbacks of the MACD indicator by using Exponential Moving Average (EMA) instead of SMA. In addition to using the EMA, it also uses a weightage co-efficient OSMAX to give more weightage to the recent signal.
In the first step we calculate the EMA of the PERIOD_FAST and the PERIOD_SLOW. The MACD is calculated by subtracting the slower EMA from the faster EMA. The MACD signal is derived by computing the EMA of the MACD using the PERIOD_SIGNAL. Finally the OSMAX is calculated by subtracting the Signal from the MACD and multiplying it by the OSMAX co-efficient. The OSMAX is plotted as an histogram.
When both the OSMAX and MACD are rising the histogram is plotted BLUE. When both OSMAX and MACD are falling the histogram is plotted RED. The histogram is plotted GRAY when OSMAX and MACD are diverging. When the OSMAX turns BLUE from RED or GRAY it implies that the trend has turned bullish. Likewise, when the OSMAX turns RED from BLUE or GRAY it implies the trend is bearish. It has been studied that OSMAX generates better results when traders enter LONG when OSMAX turns BLUE below the zero level, and enter SHORT when OSMAX turns RED above the zero level.
As compared to the standard MACD, the MACD OSMAX indicator reduces the lag and responds to price movements quickly, thus enabling the trader to enter trades earlier and exit trades before it is too late.

BUY / EXIT SHORT - Enter LONG (or exit SHORT) at the close of the candle when the indicator histogram turns BLUE below the zero level either from RED or GRAY. The stop-loss can be placed below the nearest Swing Low.
SHORT / EXIT LONG - Enter SHORT (or exit LONG) at the close of the candle when the indicator histogram turns RED above the zero level either from BLUE or GRAY. The stop-loss can be placed above the nearest Swing High.
macdosmax.png
 
CCIinMA VertexFX Indicator


s an innovative VertexFX client-side indicator based on Moving Average and Commodity Channel Index indicators.

The Commodity Channel Index (CCI) provides valuable insight of the current trend. However since the CCI is not bounded it tends to generate the signals too early or too late. The CCIinMA indicator overcomes this drawback by using a short period Moving Average (MA).

We calculate the Moving Average based on the MA_PERIOD and the MA_METHOD. The user can choose Simple (SMA), Exponential (EMA) or Weighted Moving Average (WMA). In the second step the CCI is calculated based on the CCI period. The CCI_LEVEL_UP defines the bullish breakout level and the CCI_LEVEL_DOWN defines the bearish breakout level. The indicator is plotted BLUE when the CCI is above the CCI_LEVEL_UP and RED when the CCI is below the CCI_LEVEL_DOWN. BLUE color indicates bullish trend, RED indicates a bearish trend.

BUY / EXIT SHORT - Enter LONG (or exit SHORT) at the close of candle when indicator color turns BLUE. The stop-loss can be placed below the nearest Swing Low. Do not place LONG trades if the indicator color is BLUE but the indicator is falling.
SHORT / EXIT LONG - Enter SHORT (or exit LONG) at the close of candle when indicator color turns RED. The stop-loss can be placed above the nearest Swing High. Don not place SHORT trades if the indicator color is RED but the indicator is rising.
ccin.png
 
Top