Vetex FX VTL Indicators & Scripts

Pinbar Detector Pro

Pinbar Detector is a client side VTL indicator to detect Pinbars and marks them by placing up arrow below bullish Pinbar and down arrow above bearish Pinbar. The Pinbar formation is a price action reversal pattern that shows that a certain level or price point in the market was rejected. The Pinbar is a bar with a long upper or lower “tail” and a much smaller “body”. The image below shows the Pinbar anatomy for Bullish and Bearish Pinbars.

Pinbars can be traded with different entry methods. Wait for the Pinbar to complete. Open trade at the start of next bar with a market order. Another method is opening trade on a 50% retrace of the PinBar. In this method, trader waits for the price to retrace to the midpoint of the entire Pinbar’s range. More conservative approach is to place a stoploss buy order above the high of the Bullish Pinbar and stoploss sell order below the low the Bearish Pinbar.
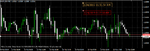
Traders can use their discretion in opening trades with the Pinbar. One of the best methods is to trade Pinbars formed in the direction of trend. This can be considered as trend continuation trades. Reversal trades can be opened when the Pinbar is formed at important resistance or support levels. See the chart attached. Placing the stoploss for the trade at the opposite end of the pin bar is good. Pinbars work best when they are formed at important support or resistance levels.

29fb6m0.png
 

Attachments

  • Pin_Bar_Detector.zip
    3.8 KB · Views: 252
Inside Bars

Inside Bar is a Client Side VTL indicator to identify Inside Bars in chart and marks the them on chart by a down arrow above the Inside Bar and an up arrow below the Inside Bar. The inside bar is a two candle price action setup. The Inside Bar is defined as a candle whose high is less than the high of prior bar and low is greater than the prior bar. It is a bar that is completely contained within the range of the preceding bar, also known as the “mother bar”. An inside bar formed on a Daily chart will sometimes look like a triangle pattern on lower timeframes such as one-hour chart. An inside bar indicates a time of indecision or consolidation. Inside bars typically occur as a market consolidates after making a large directional move, they can also occur at turning points in a market and at key decision points like major support/resistance levels. Thus inside bars represent breakout trading opportunities. Traders usually open trades on the breakout of the mother bar. Another method is to open trades on breakout of the inside bar itself.
There are basically two ways to trade an inside bar setup: As a continuation signal or as a reversal signal. The image illustrates these setups. When an inside bar is formed in an uptrend, it is a temporary pause of the uptrend. So upward breakout of the mother bar is likely to present a good trading opportunity. In a down trend, downward breakout of the mother bar presents a good sell opportunity. At key support/Resistance levels, the Inside Bar setup will act as a trend reversal setup. Traders should use discretion in picking inside bars for trading. Inside bars formed inside a trading range is not good for breakout trades as the consolidation will continue till price break out from the trading range.

2j3pll0.png
 

Attachments

  • Inside Bar.zip
    2.7 KB · Views: 246
Outside Bar - VertexFX

Outside Bar is a Client Side VTL Indicator to mark outside bars on chart. The indicator plots two arrows above and below the outside bar. Outside bar is bar that has a higher high and lower low than the preceding bar. It is a short-term expansion in price range or volatility. Outside bars form at the end of a trend and on breakout moves from consolidation in a trending period. Trader must use a discretionary approach in picking the outside bar setups for trading. In a trading range outside bars breakouts may be false signals.

The method to trade outside bars is to open position in the direction of outside bar’s high or low breakout. It is better to open trades when breakout happens in the direction of the outside bar. On bullish outside bar, look for upward breakout, and for a bearish outside bar, look for downward breakout of the outside bar. Trader must use discretion in picking outside bar trading setups. There may be many outside bars in chart but they all does not make good breakout trades. Outside bars formed at key support/resistance level are good setups. Breakout from consolidation with an outside bar setup is another good trading setup. See the image attached.
ri5k41.png
 

Attachments

  • Outside Bar.zip
    2.7 KB · Views: 255
3rd Gen MA

Hello,
Third Generation Moving Average is a Client Side VTL indicator. It is an advanced version of the standard moving average (MA), which implements a rather simple lag-reducing procedure based on the longer MA period. The method was first described by Dr. Mafred Durschner. Moving averages are supposed to smooth data and to remove noise and useless information. Multiple moving average variants are used widely, for example Simple Moving Average (SMA) or Exponentially Moving Average (EMA). One challenge is that moving averages introduce a lag, i.e. the smoothed curve follows the trend usually later. 3rd generation MA reduces the lag and follows price trends closely.
As you see in the image, the 3rd Generation MA (red line) offers slightly less lag than the conventional EMA (green line) and reacts to the price changes faster. Unfortunately, it is still prone to lag and may produce false signals. You can use the 3rd Generation Moving Average indicator the same as the standard moving average, to detect the current trend direction. It can be used to generate trading signals also, price crossing the 3rd Generation MA can be used as a buy signal and vice versa for sell signals. It is better to use this with other confirmatory signals.

16b09vt.png
 

Attachments

  • 3rdGenMA.txt
    8.4 KB · Views: 312
AMA & AMA Signals

Hello,
AMA and AMA Signals is a client side VTL Indicator. It plots the Kaufman Adaptive Moving Average (KAMA) on the chart and identifies the market trend with the dots plotted on the KAMA line.
The most general use of moving average (MA) is trend identification. The rising MA line signals uptrend and declining MA line signals down trend. KAMA will closely follow prices when the price swings are relatively small and the noise is low. KAMA will adjust when the price swings widen and follow prices from a greater distance. This trend-following indicator can be used to identify the overall trend, time turning points and filter price movements. AMA and AMA Signals indicator identifies the KAMA turning points and plots green dots when the AMA is in uptrend and yellow dots when the AMA is in down trend. The dots on the AMA line can be used as a trend filter.
A simple trading strategy with this indicator is to Buy when the yellow dots turn to green dots, that is when the trend turns up. Sell position is opened when the green dots turn yellow, that is when the trend turns down. It can be used as trend filter in other trading strategies by checking the color of the dots. The KAMA line can be used as a trailing stop loss also. Another example to trade using the AMA & AMA Signal indicator is wait for price to reach support or resistance. After testing the support, if the AMA & AMA Signal Indicator gives a buy signal by plotting green dot, open a buy position. After testing a resistance, if the AMA & AMA Signal indictor gives a sell signal by plotting yellow dots, open a sell position. Stop loss can be placed a few pips above the KAMA line.
The indicator parameters:
1 KAMA Period – Period for AMA calculation
2 Fast - Fast period for AMA
3 Slow - Slow period for AMA
4 G and dk - Smoothing Constants
imqu15.png
 

Attachments

  • AMA_nd_AMA_Signal.zip
    3 KB · Views: 237
Double Inside Bar

Double Inside Bar is a Client Side VTL indicator. Double inside bar is a price action candles stick pattern where two inside bars form immediately. An inside bar is a bar whose high is less than the high of the previous bar and low is greater than the low of previous bar. The Double Inside bar pattern is two inside bars forming immediately.
Pattern detection rules are:
1 Price Bar 1 is an inside Bar.
2 Price Bar 2 is an inside Bar with price bars 3 and 4. (Bar 2 is inside the High low range of Bar 3 and Bar 4.)
See the chart with bar numbers. Note that second inside bar of the double inside bar pattern (bar number 2) is an inside bar with its preceding two bar high/low (bars 3 and 4).
The Double Inside bar pattern is marked in chart by the yellow up arrow. This pattern indicates consolidation and lack of volatility. Trading action is confined to a range during the formation of the last two bars in the pattern. The range is marked by the High and Low of Bar 2. After consolidation, breakout from this trading range will eventually occur. The Double inside bar pattern trading strategy uses this market behavior to open trades in the direction of breakout.

Trading the double inside bar pattern is really straight forward. Anticipating a breakout either up or down, place two pending stop orders few pips above the high/low of the FIRST inside bar’s mother bar, that is bar 2. See the chart attached. Once an order is triggered, the other order work as stop loss for the trade. Trailing stop loss can be applied to lock in the profits. The double inside bar pattern gives better results on higher timeframe charts.

a9qow4.png
 

Attachments

  • Double_Inside_Bar.zip
    2.6 KB · Views: 233
Harami - VertexFX

Harami is a Client Side VTL Indicator to identify Bullish and Bearish Harami candle stick patterns. When the Harami pattern appears, it depicts a condition in which the market is losing its steam in the prevailing trend direction. The Harami consists of a small real body (candle open close range is the real body) that is contained within the preceding large candles' (Master Candle) real body. A bullish Harami comes after an upward price move and bearish Harami comes after a downward price move. The VTL indicator plots an up or down arrow after the Harami pattern is confirmed, that is, on the next candle after the Harami.
A buy signal could be triggered on the day after the bullish Harami occurred, if price close higher than Harami candle’s close price. Confirming the reversal with a down trend lines is a good practice. A sell signal could be triggered on the day after bearish Harami occurs, if price close lower than Harami candle’s close price and an uptrend line break happened. Note that the Harami candle in the chart is the candle prior to the up or down arrow in chart. A sell trade example is show the chart.
The Harami detection algorithm can be customized through parameters. Open the VTL script in VTL editor and parameter values are located at the top of the script file. Change the parameter values and compile the script and apply to chart.
1 Minimum Master Bar Size - Value in Pips
2 Maximum Master Bar Size - Value in Pips
3 Minimum Harami Bar Size – Value in Pips
4 Maximum Harami Bar Size – Value in Pips
5 Maximum Harami Bar to Master Bar Ratio
6 Minimum Harami Bar to Master Bar Ratio
7 Arrow Offset - Marker arrow offset from High/Low of Bar

243f7uw.png
 

Attachments

  • Double_Inside_Bar.zip
    2.6 KB · Views: 245
Hull Moving average

Hull Moving Average (HMA) is Client Side VTL Indicator, is an extremely fast and smooth moving average that almost eliminates the lag associated with moving averages. The major disadvantage with moving averages is the inherent lag associated with them. HMA reduces the lag with common moving averages like Simple MA and Exponential MA.
HMA calculation process is first you define the HMA period (e.g. period = 16). Then,
1 Calculate the Weighted Moving Average (WMA) for half of the period (period/2, i.e. 16/2 = 8) and for full period (16) WMA.
2 Subtract the full period WMA from half period WMA multiplied by 2. (WMA(8)*2 – WMA(16))
3 Calculate the square root of the full period. (Sqrt(16) = 4)
4 Calculate WMA with square root of period in step 3 as period on the result got in step 2. (WMA(4) of result in step 2)

Like moving averages HMA is used to identify the trend direction. The direction of the HMA line shows the trend direction. When the HMA line is rising, trend is up and when the HMA line is falling trend is down. Also price trading above the HMA indicates uptrend and price trading below HMA line indicates down trend. Slope of the HMA line shows the strength of the trend.

HMA can be used to generate entry signals in trading strategies. First find the long term trend by the use of trend lines or any other trend identification method. A short term HMA is used for entry signals with this trend. In long term uptrend, when the short term HMA turns up, buy position can be opened. In long term down trend, when short term HMA turns down after a pullback, short position can be opened. The chart attached shows an example sell trade with trend line and HMA. After the trend line is drawn with major swing highs, wait for price to pull back, in the pull back HMA will rise. When the HMA turn down again open Sell position.

The HMA indicator has the following parameters.
1 HMA Period – Period for HMA calculation
2 MA Shift - Shift if HMA is used as displaced moving average
3 MA Method – Moving average Calculation Method for internal indicator formula. Values can be 0 - SMA, 1 - EMA, 2 - SMMA, 3 – LWMA
4 MA Price - Price field used for HMA. Values can be 0 - Close, 1 - Open, 2 - High, 3 - Low 4 - Median, 5 - Typical 6 - weighted
3zxuh.png
 

Attachments

  • Double_Inside_Bar.zip
    2.6 KB · Views: 238
Price Action

Price Action is a Client Side VTL Indicator to display the important price action candle stick patterns; Pin Bars, Inside Bars and Engulfing Bars. The patterns are marked in chart by vertical lines below the candle chart in a new pane.
• Red – Pin Bars
• Green – Engulfing Bar
• Yellow – Inside Bar
The height of the vertical line shows the strength of each pattern with a scale 1 to 4. The pattern strength is calculated based on how the pattern is formed in relation to its adjacent four bars. The higher the line the stronger the pattern. Pattern Name and whether the pattern is bullish or bearish and pattern strength is displayed in the Data Window tab of the terminal.
Trading Strategies:
Pin Bars – Pin bars usually indicate trend reversal. When they are formed at support resistance levels, they generate strong signals. A bullish pin bar is formed at a support level and the pattern strength is 3 or 4, odds favor a price reversal. Trades can be opened above the high of the pin bar. When Bearish Pin bar is formed at resistance level and pattern strength reads 3 or 4, then short position can be opened on a break of the low of the Pin Bar.
Engulfing Bar: Similar to Pin bars, strong Engulfing bars formed at support or resistance levels are good trading signals. Open trades on breakout of the engulfing bar in the direction of the Engulfing Bar.
Inside Bar: Inside Bars represent consolidation. They are suitable for breakout trading. When a strong inside bar pattern is picked by the Price Action indicator, open new trades on breakout of the mother bar.

2vaji0z.png
 

Attachments

  • Price_Action_Indicator.zip
    3.5 KB · Views: 244
Outside Bar - VertexFX

Outside Inside Bar is a candlestick chart pattern where an inside bar is immediately followed by an outside bar. An inside bar is a bar with its high less than the previous bar high and low greater than its previous bar low. An outside bar is a bar with its high greater than its previous bar high and low less than its previous bar low. An outside bar indicates strong prices movement in both directions, up and down. Inside bar indicates lack of direction in price movement. Thus the Outside Inside Bar pattern indicates a temporary pause after a strong price move in both directions. This will lead to a breakout from the trading range marked by the inside bar.
See the chart attached. The pattern is marked in chart by the yellow up arrow below the inside bar of the pattern. Note that the prior bar is an outside bar.

Outside Inside Bar Trading Strategy:
When an outside bar inside bar pattern is formed, place a stop buy order few pips above the high of the inside bar and place a stop sell order few pips below the low of the inside bar. Opposite end of the outside bar can be used as stop loss. Trailing stop loss can be used to lock in profits as price moves in the direction of breakout. The chart attached shows the trigger level and stop loss placement for both buy and sell trades. The pattern generates better trades on higher time frame charts like four hour or daily chart.

23itf6w.png
 

Attachments

  • Outside_Inside_Bar.zip
    2.2 KB · Views: 294
Inside Bar Outside Bar

Inside Bar Outside Bar is VTL Client Side indicator to identify the Inside Bar and Outside Bar candle patterns. Inside Bar is a price bar with its high less than previous bar’s high and low greater than previous bar’s low. They are marked by the red arrows in chart. Outside Bar is a price bar with its high greater than previous bar’s high and low less than previous bar’s low. They are marked by the blue arrows in chart.
Inside Bar Trading Strategy
An Inside Bar means a contraction in price range or volatility. It is a pause in price movement and does not show any strength in price direction. This will lead to a breakout from this trading range.
Identify the trend direction and place a stop buy order few pips above the high of the inside bar if the trend is up. In down trend place a stop sell order few pips below the low of the inside bar. Stoploss is placed few pips beyond the opposite end of the inside bar.
Outside Bar Trading Strategy
An Outside Bar means a short term expansion in price range or volatility. It shows strength in both directions. Look for outside bar at a resistance or support level. When outside bar is formed at a resistance level, sell breakdown of the low of the outside bar. When outside bar is formed at a support level, buy breakout of the high of the outside bar. Stoploss is placed few pips beyond the opposite end of the inside bar.

33otny9.png
 

Attachments

  • insideBar_outsideBar.zip
    2.8 KB · Views: 268
Bollinger Bands High Low

Bollinger Bands High Low (BB HL) indicator is a finetuned version of the Standard Bollinger Bands indicator. Bollinger Bands defines and plots an upper band and lower band within which most of the price bars are confined. The calculation of Bollinger bands is based on a short term moving average that determines the trend. The upper and lower bands are two standard deviations away from the base moving average. Standard Bollinger Bands uses the closing price of each candle in its calculation. In this refined Bollinger bands High Low indicator, the upper band is based on the standard deviation of candle high and lower band is based on the standard deviation of candle low, instead of the candle close used in standard Bollinger bands. This makes the indicator more responsive to price moves and extreme levels are more accurate.
Trading Strategies
1. Bollinger Band squeeze. This might be the most common trading strategy with Bollinger bands. Bollinger band squeeze happens when the width of the band is the narrowest in recent times. This indicates a sideways trading or lack of volatility. Finally a volatility breakout will come and price will move in the breakout direction. This volatility breakout is identified by the expansion in band width.
2. Reversals at Bollinger Bands. Look for candlestick reversal patterns like engulfing bars and pin bars formed at the upper or lower band. In the chart below, a bearish pin bar is formed at the upper band. Trade bearish signals forming at upper band and bullish signals forming at lower band.
The Bollinger Bands High Low indicator can be customized through the parameters. You can change the Bollinger Band calculation period and Standard Deviation. To edit parameter values, open the VTL script in VTL Editor by right clicking on the indicator name in Navigator and select Edit. Parameters are located at the top of the script file. Edit them save, compile and attach to chart again for the new parameter values to take effect

dh8kza.png
 

Attachments

  • BB_HL.zip
    2.7 KB · Views: 290
ATR Ratio - VertexFX Indicator

ATR Ratio (Average True Range Ratio) is a VertexFX Client Side VTL Indicator. It plots the ratio between a long-term ATR and a short-Term ATR. ATR is a measurement of market volatility, when the price trend is strong, ATR values rise and consolidation is marked by low ATR values. ATR ratio shows the present market volatility in relation to long term market volatility. It is calculated by dividing the short term ATR with Long term ATR. ATR Ratio above one indicates the current market volatility is higher.
How to Use ATR Ratio Indicator
The ATR ratio indicator does not generate trading signals, it is a confirmatory indicator. When a new trend begins, usually the indicator value climbs above one. Identify the direction of the trend from chart with the help of moving averages or trend lines and then initiate trades when the ATR ratio indicator climbs above one. The image shows a short trade setup. After a consolidation, price breaks below the moving average. As you can see in the area highlighted by vertical box, price remains below the MA and ATR ratio climbs above one. This is the ideal time to open a short trade.

When the ATR ratio falls below one and stays there, it is clearly telling that the trend has lost momentum. Open positions can be closed when this happens, and wait for the next breakout.

Parameters
ATR Ratio can be customized through the parameters. Long Term ATR Period and Short Term ATR period are defined by the parameters. Default values are 7 and 49. To change the parameter values, open the script in VTL editor by right clicking on the indicator name in navigator and select edit. The script is now opened in the VTL editor. Parameters are located at the top of the script file. Change the parameter values, save and compile. Apply again to chart for the new parameter values to take effect.

ors5qh.png
 

Attachments

  • ATR_Ratio.zip
    2.4 KB · Views: 265
VTL Auto trend line trader is a VertexFX VTL EA supporting VertexFX 10 and VertexFX 11.

Draw trend lines on the chart and then the Auto Trend Line EA trades the breakout of these trend lines. Attach the EA to the chart on which the trend lines are drawn. Enter the name of the Uptrend Line and Down Trend Line into the parameters. We usually buy on the breakout of a downtrend line and Sell on the breakout of an uptrend line. In parameters, the Down Trend line is named Buy Trend Line and Uptrend Line is named Sell Trendline. When the EA is attached to the chart, The EA takes control of the trend lines. The buy Trendline is marked with Green dots and Sell trend line is marked with red dots. The trend line is extended as new bars are formed in the chart. EA can manage the risk through stop loss, take profit and trailing stop loss etc.

vstore.co for more information

TrendLine.png
 

Attachments

  • VTL_TrendLineTrader.zip
    4.3 KB · Views: 286
SupRes.png


VTL Support Resistance breakout EA open trade when a Support or Resistance level is broken. Enter the support and resistance level into the EA and open position when that level is broken. It can manage the risk through stop loss, take profit and trailing stop loss etc. When the EA is attached to the chart, it will draw the support and resistance levels in the chart. The green line is the support level and the red line is the resistance level. Breakouts are based on the bid price because this is the price usually displayed in the chart.

The EA has a built-in feature to limit trading time. This makes the EA able to auto trade only during London Session, US Session open etc. It helps in avoiding times when there is usually rangebound trading like the Asian session. Another key feature is the breakout level filter. Sometimes price just touches the support or resistance level and then reverse. To avoid such situations, the filter parameters add some pips to these levels. This makes the EA open a trade when the price is clearly trading above/below the levels.
 

Attachments

  • VTL_SupportResistanceTrader.zip
    3.5 KB · Views: 311
Traders usually draw support and resistance lines on chart and when price reach these lines, they watch price action closely for breakout or reversal trade opportunities. When price is trading away from these levels, they are not much involved in watching price action. The Line Alert EA trigger an alert when price touches any horizontal line drawn on chart. Just attach the indicator to chart and wait. When any of these lines are touched, an alert window will popup on the desktop and a sound is played. When this Line Alert is on chart, no need to watch the chart continuously for price touching these levels. You can do other tasks, and when price comes to these levels, you are instantly alerted of which level price just reached.

find more at vstore.co
 

Attachments

  • CloseAll.png
    CloseAll.png
    147 KB · Views: 277
Digital Clock

Digital Clock Client Side VTL Script attach a clock to your chart. It can display the server time as well as the local time. When attaching to chart, two clocks will be displayed on chart. The golden color clock is the local time and the red color clock is Server Time. These clocks can be moved around the chart with mouse. If you want to display only one clock, then delete the other clock. The server clock synchronizes time with the VertexFX server every 10 seconds. The server time is the time displayed on the chart. The time on terminals bottom panel may be different depending on the GMT settings for your account.
 

Attachments

  • DigitalClock.png
    DigitalClock.png
    29.5 KB · Views: 281
Bollinger Bands Stops.

Bollinger Bands stops is a trend following indicator. The green line indicates uptrend and red line indicates down trend. When price close above the red line, up trend begins. Buy Positions can be opened immediately or on a pull back to a support level in the new uptrend. The green line can be used as a stop loss. Similarly, when the red line appears, sell positions can be opened immediately or on pullback to resistance with the red line as stop loss. This indicator works best in trending markets, in consolidating markets signals may be not effective.
v2qn2s.png
 

Attachments

  • BollingerBands Stops.zip
    2.6 KB · Views: 249
vertex is New platform for trading - better then mt4...i have tested this platform...looks interesting....need to try code something there. nice thread!
 
Top