Running through a new winter portfolio I've set up for someone else I thought I'd post an example of taking your charts at face value. (And the dangers of it).
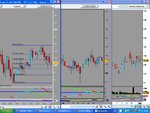
The 2 charts on the right are daily charts of the same share. One is a sb co's chart.
They both use the same provider.
Look closely at the candles. Why the difference?
Probably they start at different times.
But if you put a lot of weight behind doji's, outside/inside bars, hanging whatists etc. Which one is the real one?
And how do you time an entry?