You are using an out of date browser. It may not display this or other websites correctly.
You should upgrade or use an alternative browser.
You should upgrade or use an alternative browser.
USD/JPY analysis
- Thread starter inakocibelli
- Start date
- Watchers 43
Well here are the H1 and daily charts.
I see my EA reckons it should go lower...…….
How is your EA? Is it good making money? I ask because i bought one that really worked for 1 month and then began losing like crazy.
Pat494
Legendary member
- Messages
- 14,614
- Likes
- 1,588
How is your EA? Is it good making money? I ask because i bought one that really worked for 1 month and then began losing like crazy.
My present EA is awaiting change. I have written out a new system which looks good, for it to be coded up. I have been on a lookout for a profitable one for years and been disappointed by the ones one can find on the net. Some look good but have a martingale betting system which eventually crash. Sounds a bit like your experience ?
hatemypips
Established member
- Messages
- 697
- Likes
- 62
Well here are the H1 and daily charts.
I see my EA reckons it should go lower...…….
Bearish play is good if you expect global stocks to go lower. Flight to save heavens will take its effect on Yen for sure.
But if we bottomed out in S&P500, then you maybe be against the crowd, as buying Yen in the end or middle of the panic wave never ended good.
On the four hout time frame the USD/JPY pair remans limited on the upside, as the 100-day SMA is heading towards south, while technical indicators are hovering around their midlines with no directional strength. The top of the week at 111.89 comes as immediate resistance as the pair also has the above mentioned 100-day SMA around it. Given this positive tone of equities, a steeper decline would seem unlikely today and moreover if the bulls keep above the 112.10/20 price area.
USD/JPY remains on negative ground, despite the limited downward potential. On the four hour time frame the price is developing below a congestion of moving averages, all of them lacking of clear direction. RSI and stochastic are located within bearish territory. Currently the pair is trading around around 112.60 and in order to return to the bullish mode, will need to surpass the weekly highs below 112.90. On the other hand, a renewed selling interest below 111.85 would open doors for a further decline toward the 111.00 area.
My present EA is awaiting change. I have written out a new system which looks good, for it to be coded up. I have been on a lookout for a profitable one for years and been disappointed by the ones one can find on the net. Some look good but have a martingale betting system which eventually crash. Sounds a bit like your experience ?
Yes it realy sounds like my experience, so you are coding one of your own design, i think thats the way to go. Good luck.
Pat494
Legendary member
- Messages
- 14,614
- Likes
- 1,588
Yes it realy sounds like my experience, so you are coding one of your own design, i think thats the way to go. Good luck.
This is my 5th and probably last try to make a profitable EA.
It's harder than it sounds.
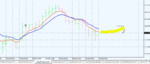
Having the intraday technical readings, the USD/JPY pair favors a downward extension. On the four hour time frame the price is developing well below its 100-day and 200-day SMAs, with both crossing each other. RSI and stochastic are heading very strong towards south. We may expect further declines , espacially if breaking below the 111.62 level.
USD/JPY recovered today and currently is trading around mis 112s. But to return into bullish mode, the pair will need to advance beyond 112.90. On the four hour time frame the price is developing below its 100-day and 200-day SMAs whie RSI and stohstic pushed above their mid-lines. Immediate resistance is offered by 112.60, and next one is seen at 112.90, which is breaking to above would bring a steeper recovery towards 113.40.
Which time frame do you trade on as they usually look very different ?
I usually trade on H1 time-frame but also give a look at the daily.
And you?
Pat494
Legendary member
- Messages
- 14,614
- Likes
- 1,588
I usually trade on H1 time-frame but also give a look at the daily.
And you?
Same
The H1 & H4 are bullish and the daily looks set for a bull run too.
Time for a long imho
Last edited:
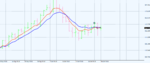
USD/JPY is showing strong positive tone in the short-term. Ont he four hour time frame the parice is developing above its moving averages, all of them almost flat now. Stochastic has reached extreme overbought readings, while RSI is looking for direction around 63 level. As long as are holding above 112.60, the pair is poised to extend its advance towards 113.40.
Same
The H1 & H4 are bullish and the daily looks set for a bull run too.
Time for a long imho
I will wait for a pullback toward 112.711.
Pat494
Legendary member
- Messages
- 14,614
- Likes
- 1,588
Same
The H1 & H4 are bullish and the daily looks set for a bull run too.
Time for a long imho
Points taken.
Flattish outlook before next move imho
Attachments
Similar threads
- Replies
- 0
- Views
- 2K
- Replies
- 4
- Views
- 4K
- Replies
- 26
- Views
- 6K