Sounds a brilliant idea thanks for sharing BCT!BlueChip Trader said:One way to learn read level II screen is to record it using programme such as Camtasia Studio, then replay the action as many times as you like to understand and see exactly what market makers do at key turning points. I having difficulty uploading a sample video so I'll attach some screen shots.
IHTH
You are using an out of date browser. It may not display this or other websites correctly.
You should upgrade or use an alternative browser.
You should upgrade or use an alternative browser.
BlueChip Trader
Active member
- Messages
- 165
- Likes
- 4
compoundup
Junior member
- Messages
- 25
- Likes
- 1
I second Dave's comment about Level 2. I approached trading with a chartist's view, and training one-to-one with Richard (Mr Charts) over 2 years ago.
I wouldn't attempt to trade without Level 2. I think Richard who is primarily a chartist wouldn't trade without level 2 either.
You just can't see what is really going on with a chart and a time/sales window. In a fast market, the order book can move a long way from the last charted trade and several seconds can elapse before the next trade prints on the chart. I use eSignal for both charts and level 2 so it is not as though I am seeing a discrepancy between different providers.
Some prefer to highlight the "Ax" for each stock. I have the seven big players highlighted in different colours so that I can see them all the time whichever stock I am looking at, (Goldman, Lehman, Merrill, MorganS, Knight, Citigroup and UBS).
I look for gaps in the book as a guide to probability of the direction of a move to support my thinking. If I don't see a gap or it is on the wrong side of the book I will think twice about taking the trade because my thinking is not being confirmed. By "gap" I mean whether or not there is a continuous progression of prices or if a few get taken out is there a gap to next resistance/support. If I have a chance of capturing a gap, it helps.
Is there a spread? Can I trade it? I switch between market and limit orders accordingly.
Via-trader helps me get to the action. Alan and Aboudy have developed a fine tool.
I was at the click-events Heathrow seminar a couple of weeks back, just in front of Lee on the other side of the aisle. I was the one asking Alan the awkward questions 🙂
Shame there's not been much follow-through the last couple of days. Let's hope Bernanke's little chat with Congress brings the volatility back.
Edward
Thank you Edward.compoundup said:I second Dave's comment about Level 2. I approached trading with a chartist's view, and training one-to-one with Richard (Mr Charts) over 2 years ago.
I wouldn't attempt to trade without Level 2. I think Richard who is primarily a chartist wouldn't trade without level 2 either.
You just can't see what is really going on with a chart and a time/sales window. In a fast market, the order book can move a long way from the last charted trade and several seconds can elapse before the next trade prints on the chart. I use eSignal for both charts and level 2 so it is not as though I am seeing a discrepancy between different providers.
Some prefer to highlight the "Ax" for each stock. I have the seven big players highlighted in different colours so that I can see them all the time whichever stock I am looking at, (Goldman, Lehman, Merrill, MorganS, Knight, Citigroup and UBS).
I look for gaps in the book as a guide to probability of the direction of a move to support my thinking. If I don't see a gap or it is on the wrong side of the book I will think twice about taking the trade because my thinking is not being confirmed. By "gap" I mean whether or not there is a continuous progression of prices or if a few get taken out is there a gap to next resistance/support. If I have a chance of capturing a gap, it helps.
Is there a spread? Can I trade it? I switch between market and limit orders accordingly.
Via-trader helps me get to the action. Alan and Aboudy have developed a fine tool.
I was at the click-events Heathrow seminar a couple of weeks back, just in front of Lee on the other side of the aisle. I was the one asking Alan the awkward questions 🙂
Shame there's not been much follow-through the last couple of days. Let's hope Bernanke's little chat with Congress brings the volatility back.
Edward
Yeah I hope tomorrow will bring some volatility. It's been really quiet last couple of days. We'll see what happens. Good Luck.
-Dave
PitBull
Established member
- Messages
- 620
- Likes
- 59
AAPL is like poetry in motion
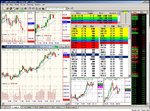
As I spoke about on Friday and today, when everything lines up, it makes effortless trading. A picture speaks a thousand words so I have attached a picture of one of my screens.
In summary, AAPL was in an uptrend, so were the indices. I got in @ 67 whilst it was consolidating and making higher lows. ETRD was the man to watch as he was holding the bid. He started to raise his bid and this was my signal. Throughout the move the futures were strong, all timeframe charts of the stock were in sync. ETRD kept on raising his bid and lifting his offer. Other MM's came in, but I was only interested in ETRD as he has been buying solidly throughout.
The 5 min chart looks strong all the way up to 67.90. It becomes over extended on the 1 min, it snaps back and closes below. I then sell half @ 67.69. At the same time there is an up spike on the 15min chart. The futures make a pullback and off we go again. The MA's are all strong.
68 approaches and the MM's are stacked on the offer. Why would you want to sell this stock when it is so strong? 😉 Well, to fool newbies into thinking they are sellers, when in fact they are on the opposite side. It retraces slightly, in order that the MM's can buy at a better price.
It takes out the 68 offers (>30k shares displayed) like a hot knife through butter as all the offers are pulled. I trail my stop up to 67.80. It comes back and consolidates a little, together with the futures. ETRD holds it down at 68.10. there are narrow range bars forming on the 15 min, (doji's). ETRD lowers his offer to 67.95. I now know that we aint getting past 68 for the time being.
I exit at 67.92. Wise as it has just broken the 10 MA on the 5min.
Attachments
PitBull said:As I spoke about on Friday and today, when everything lines up, it makes effortless trading. A picture speaks a thousand words so I have attached a picture of one of my screens.
In summary, AAPL was in an uptrend, so were the indices. I got in @ 67 whilst it was consolidating and making higher lows. ETRD was the man to watch as he was holding the bid. He started to raise his bid and this was my signal. Throughout the move the futures were strong, all timeframe charts of the stock were in sync. ETRD kept on raising his bid and lifting his offer. Other MM's came in, but I was only interested in ETRD as he has been buying solidly throughout.
The 5 min chart looks strong all the way up to 67.90. It becomes over extended on the 1 min, it snaps back and closes below. I then sell half @ 67.69. At the same time there is an up spike on the 15min chart. The futures make a pullback and off we go again. The MA's are all strong.
68 approaches and the MM's are stacked on the offer. Why would you want to sell this stock when it is so strong? 😉 Well, to fool newbies into thinking they are sellers, when in fact they are on the opposite side. It retraces slightly, in order that the MM's can buy at a better price.
It takes out the 68 offers (>30k shares displayed) like a hot knife through butter as all the offers are pulled. I trail my stop up to 67.80. It comes back and consolidates a little, together with the futures. ETRD holds it down at 68.10. there are narrow range bars forming on the 15 min, (doji's). ETRD lowers his offer to 67.95. I now know that we aint getting past 68 for the time being.
I exit at 67.92. Wise as it has just broken the 10 MA on the 5min.
Hi Pitbull
Nice Commentary , thanks for taking the time to post.
Didn't trade tonight but your post has given me a few ideas.
Thanks again to you and everybody who had posted
Cheers
AC
PitBull
Established member
- Messages
- 620
- Likes
- 59
samtron said:Great post PitBull.
On the run up was ETRD ever seen on the Inside?
Hi Peter
Yes he was.
IMO, determining who is the "big cheese" is what we should try and establish first of all. My criteria for this is as follows, and this is based on my own observations and not from any coaching:
1) The MM who is the last to leave the inside bid/ask
2) He has jumped to the inside bid/ask more than any other MM
3) He comes in on the inside to support a falling stock
4) He will move up or down in certain price increments
5) He will use "reserve orders", i.e. only show 100 shares, but the T&S will show a different story
6) And he will be transacting >3k shares or more
As I said, this is what I sometimes see and not all of the above may happen.
It would be good to hear other peoples opinions, especially dvdh.
Regards
Pitbull
p.s. Even though NasdaqTrader.com details the monthly share volume in order to identify the axe, the primary axe may not be "out to play". So, if it says GSCO is the axe, and he is not active on the L2 screen, but rather a passive buyer or seller, then I will pass on him, as he is not showing me anything. Again, this is my own opinion.
Last edited:
PitBull
Established member
- Messages
- 620
- Likes
- 59
This is the current share volume on AAPL for January 2006. UBSS has been very active in the hot tech stocks lately, AAPL & SNDK.
Rank 2nd was INET, not shown below.
BRUT Volume Rank
NASDAQ/Brut Market Center 82,065,301* 1*
UBSS
UBS Securities LLC 61,710,039* 3*
ETRD
E*Trade Capital Markets LLC 33,975,945* 4*
GSCO
GOLDMAN, SACHS & CO. 30,360,595* 5*
p.s. BRUT is an ECN, so ignore him as the axe
Rank 2nd was INET, not shown below.
BRUT Volume Rank
NASDAQ/Brut Market Center 82,065,301* 1*
UBSS
UBS Securities LLC 61,710,039* 3*
ETRD
E*Trade Capital Markets LLC 33,975,945* 4*
GSCO
GOLDMAN, SACHS & CO. 30,360,595* 5*
p.s. BRUT is an ECN, so ignore him as the axe
Last edited:
I'd love to explain you guys how I think about this, but unfortunately I'm not allowed. I have to forward you to Mr. Charts. :cheesy: :cheesy:PitBull said:Hi Peter
Yes he was.
IMO, determining who is the "big cheese" is what we should try and establish first of all. My criteria for this is as follows, and this is based on my own observations and not from any coaching:
1) The MM who is the last to leave the inside bid/ask
2) He has jumped to the inside bid/ask more than any other MM
3) He comes in on the inside to support a falling stock
4) He will move up or down in certain price increments
5) He will use "reserve orders", i.e. only show 100 shares, but the T&S will show a different story
6) And he will be transacting >3k shares or more
As I said, this is what I sometimes see and not all of the above may happen.
It would be good to hear other peoples opinions, especially dvdh.
Regards
Pitbull
p.s. Even though NasdaqTrader.com details the monthly share volume in order to identify the axe, the primary axe may not be "out to play". So, if it says GSCO is the axe, and he is not active on the L2 screen, but rather a passive buyer or seller, then I will pass on him, as he is not showing me anything. Again, this is my own opinion.
MarketMakers play a lot of different games, they'll try everything to fool you, that's all I can say.
By the way, about what you got from NasdaqTrader.com: BRUT is not a marketmaker, but an ECN. I think you guys know that right?
I hope I said something usefull?!?!
-Dave.
PitBull
Established member
- Messages
- 620
- Likes
- 59
dvdh said:I hope I said something usefull?!?!
-Dave.
You don't have to reveal the crown jewels. I respect the confidentiality of what Mr C taught you.
I'm just trying to get a meaningful discussion going on regarding L2.
Regards
Last edited:
Naz
Experienced member
- Messages
- 1,391
- Likes
- 25
Here is some info that i believe in which many others dont i'm sure. Completely different to what others might teach. It is only a personal view though.
Many will try and make use of Totalview, i attach a screen shot.
I taught Pitbull and he is correct that a marketmaker is a buyer when he shows a 100 shares. Now many think the holy grail on level 2 is Totalview because it adds up all the shares at a certain level and displays them as one big group.
The thinking being that you can spot supply and demand easier. WRONG, supply and demand that others want you to see. Traders buy stock and then spoof the bid to make it look like it should go up.
If a mm is truly a buyer when he shows a 100 shares at key times then on Totalview the the complete opposite of what should happen will occur.
Attachments
Good morning Lee!
FWIW, I was in AAPL yesterday pm but messed it up! Didn't lose, but messed it up none the less. My fault of course. But that was down to what was going on in that head of mine! (I ordered Trading in the Zone when I was done lol!)
Personally, I was looking SBSH and also Lehman. The reason I was following these rather than E Trade was that I thought that E-Trade was predominantly day traders rather than the big money, i.e. the big 6 or 7. Of course I may be wrong in this. I look firstly to identify who the ax is in nasdaqtrader.com, then look to see if he's out to play on the L2 screen. Like compoundup, I have the biguns highlighted so I can what they are up to amongst the noise. If the ax, as per nasdaqtrader.com, isn't playing ball then I look to see which, if any of the big boys is playing. And of course, sometimes none of them are really out to play at all and may be sitting either side of a biggish range say $1 plus and the short term price action is being driven by the masses on the ECNs. However, one also needs to be aware that the Big Boys use the ECN's too of course.
As an aside, until recently, I didn't really know much about the big investment banks and am currently reading "Greed Merchants" by Philip Arnott (I think that's his name without going upstairs to check). It's not required reading, but gives you an insight into investment banking and into what a strong hold these big boys have had over the last 20 years or so, under various guises what with mergers etc etc. If you have trouble getting to sleep at night, read this! It's not the easiest read, but interesting nonetheless.
JonnyT said:Mr Charts strategy didn't include Level II when I attended his training!
He offers a specialist L2 course these days, either 121 or by correspondance.
Naz
Experienced member
- Messages
- 1,391
- Likes
- 25
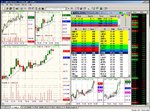
I attach an example.
The best time for many scalps is when the opposite to what Totalview implies, happens to be the case.
Attachment one, a falling stock, Totalview would show lots of selling and lack of buying.
Attachment two, my entry, its not the size of orders that count but what is really going on behind the scenes. Its a buy.
Attachment three. My account details showing my entry and exit for a 40c move.
I realise that this is my own view and not what many others are shown or many data vendors lead clients to believe. In that case i'm sure i'm in the minority.
Naz
Attachments
Hi Naz,Naz said:Here is some info that i believe in which many others dont i'm sure. Completely different to what others might teach. It is only a personal view though.
Many will try and make use of Totalview, i attach a screen shot.
I taught Pitbull and he is correct that a marketmaker is a buyer when he shows a 100 shares. Now many think the holy grail on level 2 is Totalview because it adds up all the shares at a certain level and displays them as one big group.
The thinking being that you can spot supply and demand easier. WRONG, supply and demand that others want you to see. Traders buy stock and then spoof the bid to make it look like it should go up.
If a mm is truly a buyer when he shows a 100 shares at key times then on Totalview the the complete opposite of what should happen will occur.
you're completely right. I subscribed to esignal Level II first thing on monday morning after you told me about it in London. Mr. Charts told me too, but I thought I could see the same thing in Totalview. I was completely wrong. Totalview makes everything blurry. I'm gonna stick with Level II now. Thanks for telling me that by the way. I appreciate it.
-Dave.
PitBull
Established member
- Messages
- 620
- Likes
- 59
jimmy1jag said:Good morning Lee!
Personally, I was looking SBSH and also Lehman. The reason I was following these rather than E Trade was that I thought that E-Trade was predominantly day traders rather than the big money, i.e. the big 6 or 7. Of course I may be wrong in this.Yes, but if ETRD transacts the second most number of shares then he has big money orders. Whether he is retail or not and he was moving about the screen the most.
I don' t know why ETRD would be an axe. Is he just transacting on behalf of daytraders? I dunno.
Hey dvdh your not on commission are you :cheesy:dvdh said:I'd love to explain you guys how I think about this, but unfortunately I'm not allowed. I have to forward you to Mr. Charts. :cheesy: :cheesy:
MarketMakers play a lot of different games, they'll try everything to fool you, that's all I can say.
By the way, about what you got from NasdaqTrader.com: BRUT is not a marketmaker, but an ECN. I think you guys know that right?
I hope I said something usefull?!?!
-Dave.
This discussion on L2 is really great (all credit to Pitbull, yet again, for kicking it off), I must admit I am having a job getting my head round it at the moment.
I have got the set-up suggested by BCT working so I can watch the moves again and again and......... 😱
this thread is getting hot 😎
PitBull said:jimmy1jag said:Good morning Lee!
Personally, I was looking SBSH and also Lehman. The reason I was following these rather than E Trade was that I thought that E-Trade was predominantly day traders rather than the big money, i.e. the big 6 or 7. Of course I may be wrong in this.ETRD is a marketmaker. Not an ECN. A marketmaker is obligated to make a market. So he can definately be an active marketmaker.Yes, but if ETRD transacts the second most number of shares then he has big money orders. Whether he is retail or not and he was moving about the screen the most.
I don' t know why ETRD would be an axe. Is he just transacting on behalf of daytraders? I dunno.
Everyone can see that the biggest marketmakers like UBSS SBSH and GSCO are active in the morning. And the smaller ones take over in the afternoon. Because what I heard is that the big marketmakers have algorithmic black boxes running when there's no action. And around the open they have the senior traders making the market. If there's some good action in the afternoon the big MarketMakers will take over again.
-Dave.
Similar threads
- Replies
- 775
- Views
- 229K