Best Thread US day traders thread.

Hiya Tim and Lee,
As I said in post 612, I stuck with my one minute exit rules.
So, why didn't I get out on the retracement for "fear" of losing money already earned?
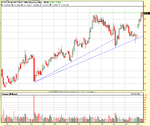
Have a look at the volume on the retracement, it's much less than on the two previous down candles so there was little strength in the retracement; hence it was likely to turn out to be a retracement, not a reversal.
How did I know the volume was going to be less at the time?
My micro-analysis on level 2 showed me the price going up on significantly less volume - at the time - in front of my eyes. Hence the probability was high the move was a retracement, not a reversal. Had that changed in front of my eyes I would have closed out the position - in other words I would have acted in accordance with the evidence in front of me, not out of "fear".
I feel the emotion as we all do, but I can subsume it under the weight of evidence.
Not my opinion, the evidence.
Those of you who know my one minute rules also know they are subject to micro-analysis.
Look at the screen shot I took at exit in the post a couple of days ago. I exited near the bottom of the move. Not at it, but not too far away. Why? Because I could see on micro-analysis there was more buying coming in although the selling hadn't abated - the volume going through was increasing sharply plus certain market participants were changing their stance. I could see all the hallmarks of a volume blow off BEFORE it happened.
This micro-analysis is invaluable to me. Amongst many other things it enables me to see what is happening and its strength as it starts to develop, BEFORE it shows up on a candle or a volume bar.

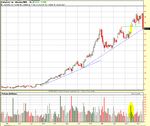
Another thing, large moves have large retracements.
I think you need to look at things in the context of the whole range of the move. It's not a matter of intestinal fortitude, more the nature of the stock price move - horses for courses.

I have just scrolled back through esignal and taken an image including volume to illustrate some of what I mean.
Hope that helps.
Richard
 

Attachments

  • SFCC.GIF
    SFCC.GIF
    5.7 KB · Views: 294
Thank you Richard. You have put it into context. It was simply a retracement in a large move, which is what I would tend to agree with. I too would be looking at volume and if not great then stay in it.

All the best
Lee
 
Mr C
Thank you for taking the time to make your recent post which I found very informative.
Micro analysis, probably overlooked by a lot of newbies like myself, especially in the heat of the moment. Your comments encouraged me to examine the chart you posted further, and I know am able to see more than I did when I first looked at it (not just the volume), things like the last swing high, the number of consecutive bears before a reversal etc interesting stuff. Being a newbie and in the heat of the battle, I am pretty sure with my present skill level, i would have failed to observe all the "micro stuff" and cut and run :D
 
Here's the MRVL trade.
First image at entry, second at exit. Chart and combination with micro-analysis was the key - as usual.
$2.53 profit

Still got my eye on it in case of a sharp break either way.
Richard
 

Attachments

  • mrvllong.GIF
    mrvllong.GIF
    4.8 KB · Views: 282
  • mrvlclosed.GIF
    mrvlclosed.GIF
    4.5 KB · Views: 236
The sharp breakdown happened five minutes after my last post - just covered for another whole dollar.
Richard
 
Mr. Charts said:
The sharp breakdown happened five minutes after my last post - just covered for another whole dollar.
Richard

Yes, I made money on Marvel today too Got in later than you going up, at 55.06 and out at 56.90, so $1.84/share. If the TradeCenter Level2 screens were working properly today I might have managed a bit more, instead of "Waiting for data......" :(

Made another $0.42/share on ADSK in 5 minutes. Got in late again, I missed the start of the reversal at 14.38 and only got in at 14.46. Got out at the right time though!

I've had a rotten week's trading but, after meeting a couple of trader friends last night, reviewed my activities this morning and it seems to have helped! Just shows the value of having impartial advice to remove the emotional overhead.

Rgds
Dave
 
Dave

Superb!! Keep it up. All a state of mind.........

No trades today as work committments. Will be back next week

Cheers
Lee
 
Add me to the MRVL list.

$2.13. per share.

No screen captures today im afraid, although it would look the same as the one that Richard posted, only with a worse exit, lol.
 
Mr. Charts said:
. . . in other words I would have acted in accordance with the evidence in front of me, not out of "fear".
I feel the emotion as we all do, but I can subsume it under the weight of evidence.
Not my opinion, the evidence.
Hi Richard,
Thanks for the expanded explanation of the trade.
Tim.
 
Tim,
You are always welcome

Lee,
Give up the day job and trade ! I gave up my profession to trade like this full time in 1999 - best thing I ever did ;-)

keano,
Good stuff as always ! ;-)

Dave,
Excellent.
SNDK has not moved cleanly this afternoon - too sloppy for my liking.
Funnily enough someone I saw last week did his first live trade on ADSK this afternoon and got 44c from it !


Richard
 
Richard

Seriously contemplating that at the moment, but want to gradually build up size as don't want to jump head first into it full time as added pressure of HAVING to make money. I'm finding it quite relaxing at the moment, with no pressures, apart from work distractions. Will give it six months and see how it goes.

Have a nice weekend
Speak soon
Lee
 
PitBull said:
Gadgetman

I hope you shorted SNDK through 57
No, I finished around 5-ish, just thought I'd bring it to attention in case anyone else fancied it.

Dave
 
PitBull said:
IMHO if COST can break the 50.25 which it did try twice on Friday then we have lift off! I will watch with interest.
As always, opinion counts for nothing when daytrading, so trade what you see not what you think.
Hi PitBull & Co.,
After my post last week I thought it would be appropriate to start a U.S. Swing Traders thread and add my vague market musings there, rather than to continually muddy the crystal clear waters of the day trading thread! Actually, as I'm not (yet) actively swing trading myself and as I still aspire to trading intra day, I hope this thread could / would / may be of interest to some of you here. So, here's the link:
http://www.trade2win.com/boards/showthread.php?t=17662
For the sake of completeness, I will post a follow up chart to COST which, this time last week I put forward as a chart to keep half an eye on. As a tease, I also offer a chart of ADSK which I know grabbed the attention of some of you last week and, indeed, some of you traded. However, a follow up to ADSK - if there is one - wil be on the other thread!

COST
This time last week I felt the sentiment favoured the bulls - but only marginally. One week later and the picture is very different. On the weekly chart (attached) last week's candle is a 'hanging man' right underneath $50 which looks like it might turn out to be a double top. All the good folks that bought last week will have been to church today, confessed all their sins and have prayed like they've never prayed before that next week sees a solid break above the $50 mark. Traditional candlestick analysis says that a hanging man candle is an ominous sign. (With a name like that, how could it be otherwise!) That said, nothing is certain, and prices could still explode through the $50 resistance barrier. Equally, if they don't, they could collapse a long way and in a very short space of time. Obviously, the key word here is 'could' so, PitBull's advice to 'trade what you see and not what you think', is very sound IMO. Either way, COST could present opportunities to the astute dat trader.

ADSK
The obvious benefit to a longer time frame is that the information it offers cuts out noise. The disadvantage is that potentially, it also cuts out useful, salient detail that traders need to know, regardless of their time frame and trading style. ADSK is, I suspect, (feel free to disagree) a case in point. On the chart attached, last week's huge bear candle masks the fact that most of the down move happened on Friday following a substantial gap down. Similarly, the earlier bull candle (highlighted in the yellow oval) masks a large gap up. That said, does the basic picture change? All the traders who bought through August (on large volume, also highlighted in a yellow oval) will be on the anxious side of very anxious next week, nervously watching to see what happens. Interestingly, the price has fallen back to the long term trend line shown in bloo. However, this is NOT the support line. That is indicated by the lateral green lines at $39 and $40 respectively. That the $39 support line coincides with the trend line is just that; coincidence. Certainly, if the price drops substantially below the $39 level, this is an ominous sign for the bulls and an early indication that the long term trend may - and I stress may - be about to change. For their part, they will want to see a strong rally next week, re-establishing support at $39 and putting significant upward pressure on $40.
Tim.
 

Attachments

  • COST_18.11.05.PNG
    COST_18.11.05.PNG
    45.2 KB · Views: 172
  • ADSK_18.11.05.PNG
    ADSK_18.11.05.PNG
    45.2 KB · Views: 180
Holidays

I see that it's Thanksgiving Day on Thursday, so guess we have a day off from the trading.

Can one of you more experienced guys tell me what happens over the Christmas and New Year breaks? Would be good to plan around the non-working days.....
Thanks
Dave
 
Spam

I keep getting spam emails, from various senders, telling me I need to buy SNFX. Apparently its "going to go through the roof|" today.

Anyone know the real originators? I'd love to start spamming them back.
Rgds
Dave
 
Top