Urban fx candlestick patterns

Heyhi

Junior member
Messages
17
Likes
0
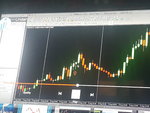
Anyone know why this guy is teaching a hanging man candlesticks as a continuation pattern and everywhere else a hanging man is a reversal pattern? Am I missing something? I'm not judging anyone or anything I'm just trying to learn if someone can explain.
 

Attachments

  • 20180302_133502.jpg
    20180302_133502.jpg
    1.7 MB · Views: 224
  • Screenshot_20180302-133532.png
    Screenshot_20180302-133532.png
    396.7 KB · Views: 289
The significance of the appearance of a 'hanging man" in an uptrend is by the nature of its pattern that some form of selling pressure has emerged. The problem is the emergence of selling pressure may simply be profit taking before buying emerges to continue the trend and so reversal becomes continuation.

While my charts are set to candle sticks format I am not a fan of candle stick patterns. Trading is about integrating many skills and tools into some coherent manner that delivers an edge that we may end up with positive expectation over many trades. The problem with "hanging man" et al in candlestick is that they are merely just random pieces of many moving parts. Applying them without understanding context is a very narrow pathway with limited utility. Unfortunately for most traders learning about this business, knowledge is acquired in pieces. It can take years to understand how to integrate the pieces into some coherent trade plan.

The most basic understanding to acquire in trading is to understand trends. How they begin, how they end, how they enter consolidation, and how they come out of consolidation. Identifying a "hanging man" without understanding those basic ideas will invariably lead to your original question.

Thanks I'm going to look at trends and start studying those. I've been studying support resistance little bit of trend and trying to understand Candlestick patterns anything else I should be looking for
 
Thing is, these candlestick and chart patterns are only really useful when price confirms what they "say". Even if that means waiting for the close of the following day before making a trade - if you're driving down the wrong road, there's no reward for missing breakfast to set off earlier.

I can't think why a hanging man in an uptrend would be taken as a bearish signal but that doesn't mean its a great bullish continuation signal either.
 
Candle stick patterns are the most simple and helping indicators for predicting the future of the market. If you want to be a successful trader then you have to grip these patterns as strongly as possible. Each pattern has its own story which you have to find out as soon as possible.
 
Top