It’s common knowledge that no market moves in one direction for an extended period without ‘pulling back’. There are many methods of analysis that try to make sense of these moves and counter-moves, these methods mostly rely on price data alone to guess the start and/or end point of a pullback. In this section, we will look at the liquidity model and how liquidity makes pullbacks inevitable. This isn’t an exercise in market theory; this knowledge will help you jump on board moves at the right time. It is not easy to sell into a rising market but if you understand the liquidity model, you will understand that at times, the market is rising because of a lack of sell side liquidity and NOT because buyers are jumping into the market.
In this section, we will look at the lowest level of the market to show liquidity; the lowest level being the order book. Do not think that the liquidity model only operates for order book scalpers. This model applies to all timeframes. The existence of liquidity is key to understanding price moves whatever timeframe you are looking at. It is merely easier to explain at the lowest level.
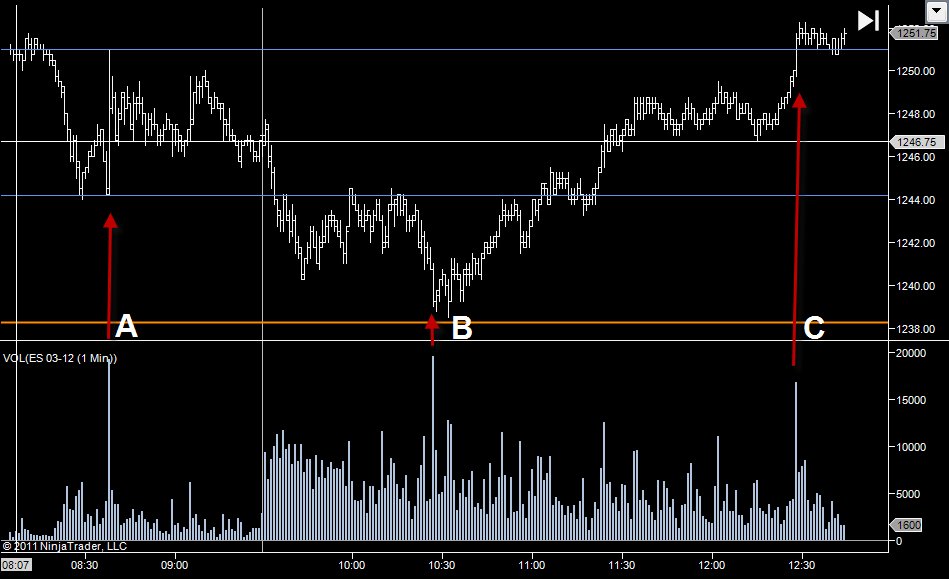
I am guessing that most people already know "don't trade the news". News releases cause some pretty violent movements in price. Have you ever stopped to wonder why? Point “A” on the chart below shows a typical news release.
We can see that at 8:38am, news was released and 20,000 contracts traded. There are two other times that day where we see a large number of contracts trade in the time period – Points “B” and “C”. At those later high volume points, the number of contracts was high but the price move itself was much smaller. The range of the bar at point “A” is 7 points. That’s a 7 point move in 1 minute!
What we are seeing there is a lack of liquidity. That is what makes the news moves so large. The volume of trading itself is only part of the picture. It is liquidity or lack of liquidity that causes the big moves.
Imagine for a minute that the market is a hi-rise building. Price can rise up when the ceiling is broken and it can move down when the floor is broken. The market does have a ceiling above and a floor below. This is in the form of limit orders and this is what we refer to when we talk of "liquidity". In the market some floors/ceilings are thicker than others and some are thinner than others.
Something needs to 'eat' these ceilings for price to move up. The eater of liquidity is called a "market order". When someone submits a market order to the market it eats some liquidity and makes that floor/ceiling a little bit thinner. To trade a market you either need to provide liquidity (limit order) or consume liquidity (market order).
This is what causes price moves. You will often hear people say “price moves up when there are more buyers than sellers”. This is impossible. The markets are a mechanism for matching buyers and sellers. If there is no seller, you will not be buying anything. The markets move up because buy market orders consumed seller liquidity at a price level. The next buy market orders will eat the liquidity at a higher price. The numbers of contract brought = the number of contracts sold.
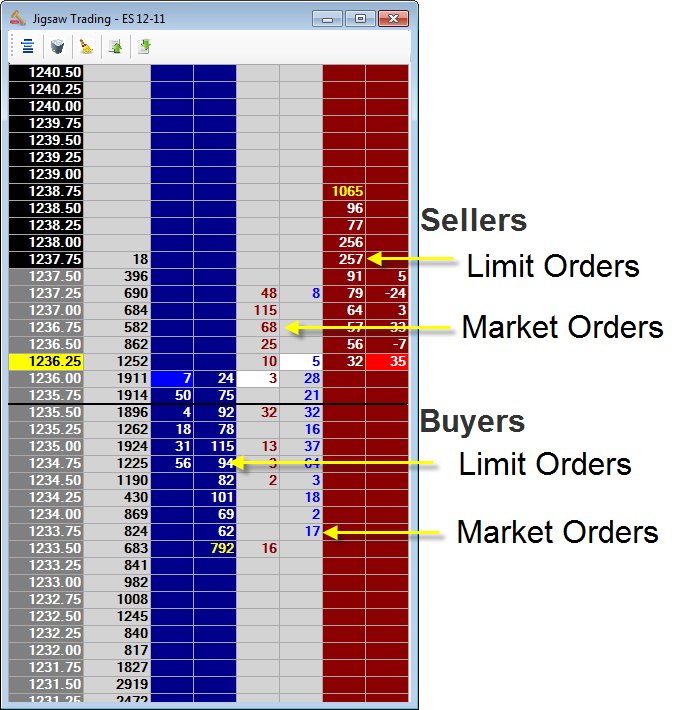
In the following image, you can see both the consumers and providers of liquidity on the order book. We can see existing Limit Orders and we can see the market orders that were filled against them
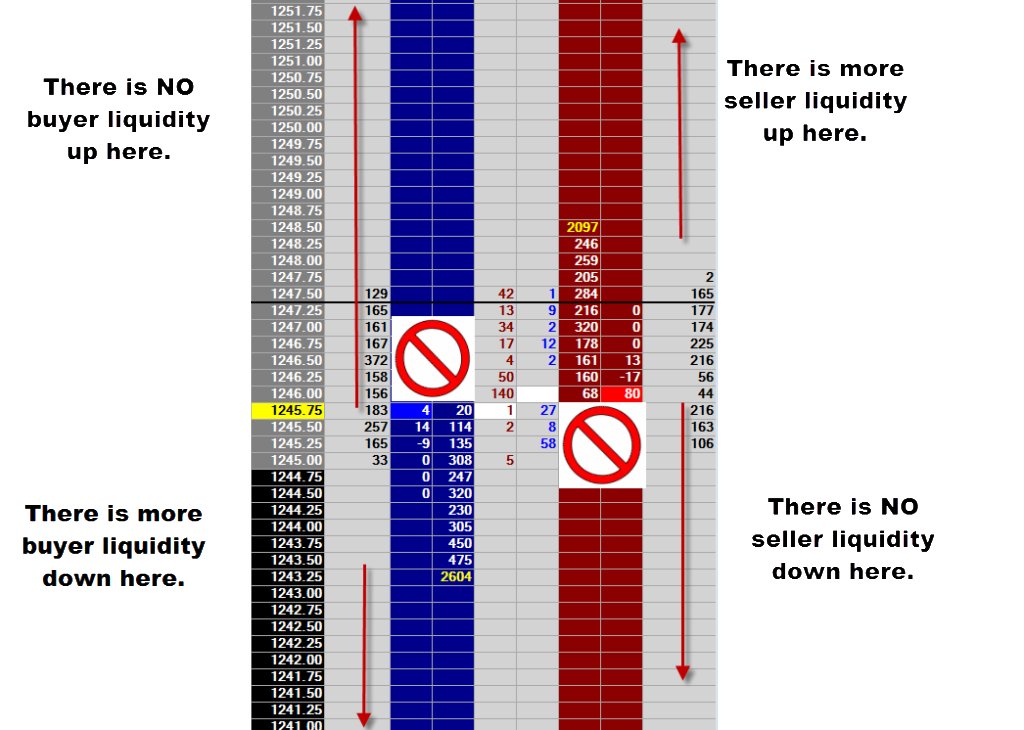
One of the most important things to understand about liquidity is that is that liquidity always and only exists at better prices than the current price. In other words, seller liquidity exists at higher prices than the current price. Buyer liquidity exists at lower prices than the current price.
This is common sense. If sellers wanted to sell below market price, then a trade would take place. Buyers would fall over themselves to buy at lower prices than market price because they would be able to turn an immediate profit.
Now, whilst liquidity only exists at better prices, ORDERS can exist at worse prices. This is not liquidity; for example a breakout trader might have a buy stop order to enter the market above the high. This is an order to enter at a worse price than current but this is going to consume liquidity, not provide it. This is not liquidity.
There is no seller liquidity below the current inside offer and there is no buyer liquidity above the current inside bid. In case this is not absolutely clear, here is a picture.
As you probably know, a lot of the limit orders we see on the DOM are fake. Some liquidity is real and some is not. This means that the numbers on the DOM won't always help us. There are some presumptions we can make about the real liquidity above and below that will help us to understand the market.
Some people are PAID to provide liquidity. These people are often called "Market Makers" and in many cases they are, although HFTs muddy the water somewhat. Anyone can be a liquidity provider and get paid to place limit orders. Most people don’t as you need deep pockets to play that game. The Market Makers get paid to place these limit orders. As price moves up and down, they are effectively capturing the spread between the inside bid and offer. They do not capture the spread at each price point; no-one can do that. What happens is that the market tends to move back where it came from and the spreads are captured over time. Market Makers have deep pockets. If a market is roaring up with no retraces, then the Market Maker is going to be short at higher and higher prices; as the price moves down, they'll unload that position, capturing their rebates and the spread as that occurs. These people aren't going to remain totally passive if things go too far against them. They can and do play games to ensure they make money. They will push the market around and shake people out whenever the opportunity arises.
These people are not a charity. They are doing it solely for their own benefit. They will stop providing liquidity when it is most needed, which is one of the things that feeds a market crash. As markets move down rapidly, liquidity providers end up with a large offside long position and they stop providing buy-side liquidity which fuels the move down. Crashes are not caused by selling; they are caused by lack of buy side liquidity. This applies to all markets; look at the US housing crash of 2008 onwards, there was a complete lack of buy side liquidity. It was not that case that everyone decided to sell their houses at the same time!
Other traders, for whatever reason, will put in limit orders at better prices than current. These may be algorithms or they may be actual people. On the sell side, people can put in limit orders to sell for higher prices. On the buy side people can put in limit orders to buy at lower prices. This is common sense, buyers want to buy low and sellers want to sell high. A trader might have put his limit order in a minute, an hour, a day or a week ago. Various people will have put in limit orders at various times putting in various amounts of thought into the process. If you are day trading, it doesn’t follow that everybody else is day trading. You might see 5000 Bid at a level and think it is somebody trying to turn the market around; this may be the case OR it may be that someone put this order for 5000 contracts in a week ago as a hedge and they aren’t really concerned at all what happens in the next 5 minutes.
One thing that is always true is that there are ZERO buy limit orders above the current price and there are ZERO sell limit orders below the current price.
This is important - so let’s put it up in bold:
"There are ZERO buy limit orders above the current price and there are ZERO sell limit orders below the current price".
Nature abhors a vacuum
If you want to understand why the market pulls back in an uptrend, keep "Nature abhors a vacuum" in mind.
- An uptrend starts.
- Price is at 1245
- There is ZERO buy side liquidity above 1245
- There IS buy side liquidity below 1245
- There IS sell side liquidity above 1245
- Market buy orders 'eat' the sell side liquidity and break through the ceiling
- Price moves up and up and up
- We are now at 1250
- There was no buy side liquidity above 1245 before
- There will be SOME buy side liquidity between 1245 and 1250 but it will be NEW liquidity that got placed there as price moved up.
- Some of this new buy side liquidity will be Market Makers who were SELLING as the market moved up
- Other people will have submitted new buy side liquidity on the way up
- Other people will still be THINKING about submitting buy side liquidity
The area between 1245->1250 now has (to an extent) a 'liquidity vacuum' on the buy side. The liquidity hasn't had chance to build up in that area as it has on the sell side. We are at 1250 - we have moved up into an area where sell side liquidity has been sitting for a while. We moved up into an area where no buy side liquidity existed before but where sell side liquidity exists. The ceiling is strong and the floor is very weak. Any uptrend will have a mix of market buyers and market sellers eating liquidity on both sides. We have market buyers and sellers, we have a strong ceiling and we have a weak floor.
- The market starts to move down as the weak floor is consumed on relatively little market selling
- Some new sellers may be thinking 'reversal' and jump on short
- As we move down, we move 'further back' in time OR to prices that have been traded a while back and where there has been more time to consider a buy side limit order
- We move down and the floor gets a little thicker
- At the same time, we move down into an area with ZERO sell side liquidity, the vacuum is now being created above us.
Eventually, we get to a point where we have a thicker floor below us and a relatively thin ceiling above. Price starts to move up and a whole bunch of traders (like me) think "Continuation". Anyone that sold the pullback starts to feel a little queasy and pukes out (by buying); we may see a little acceleration to the upside as the market becomes quite one-sided. Then the process starts over again.
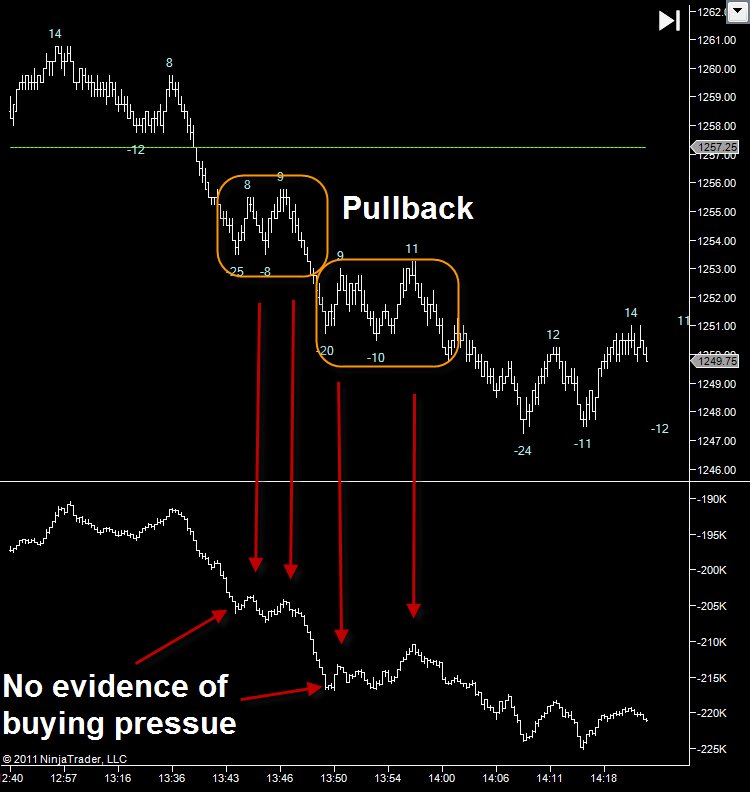
The above picture shows price and cumulative delta. To understand cumulative delta, see the following article: http://www.trade2win.com/articles/1670-trading-cumulative-delta-indicator
We can see here a typical intra-day move. The top chart shows the price and the bottom chart shows the cumulative delta. Price moves down about 14 points with 2 major pullbacks. You can see that as the market is pulling back up, the cumulative delta hardly moves up at all (relative to the down move). We can safely say that this up move was caused by lack of sell side liquidity as a 'vacuum' was created there by the down move. It didn't take many buy market orders to move the price back up to where the liquidity was.
This is where we have the confidence to sell into a move up because we know that the move is caused by a temporary lack of sell side liquidity.
In Summary
The market is like a hi-rise building. It has floors (buy limit orders) and ceilings (sell limit orders).
It takes market orders to eat these floors & ceilings.
As you move up and go through a ceiling, it takes time to rebuild the floor behind you.
This lack of a floor, or 'liquidity vacuum' is the cause of pullbacks in trends.
This represents opportunity for you. Once you know that the market is 'vacuuming back', you suddenly aren't scared of fading that pullback.
Of course, other techniques such as Tape Reading will tell you where the pullback has ended.
Peter Davies can be contacted at Jigsaw Trading
In this section, we will look at the lowest level of the market to show liquidity; the lowest level being the order book. Do not think that the liquidity model only operates for order book scalpers. This model applies to all timeframes. The existence of liquidity is key to understanding price moves whatever timeframe you are looking at. It is merely easier to explain at the lowest level.
I am guessing that most people already know "don't trade the news". News releases cause some pretty violent movements in price. Have you ever stopped to wonder why? Point “A” on the chart below shows a typical news release.

We can see that at 8:38am, news was released and 20,000 contracts traded. There are two other times that day where we see a large number of contracts trade in the time period – Points “B” and “C”. At those later high volume points, the number of contracts was high but the price move itself was much smaller. The range of the bar at point “A” is 7 points. That’s a 7 point move in 1 minute!
What we are seeing there is a lack of liquidity. That is what makes the news moves so large. The volume of trading itself is only part of the picture. It is liquidity or lack of liquidity that causes the big moves.
Imagine for a minute that the market is a hi-rise building. Price can rise up when the ceiling is broken and it can move down when the floor is broken. The market does have a ceiling above and a floor below. This is in the form of limit orders and this is what we refer to when we talk of "liquidity". In the market some floors/ceilings are thicker than others and some are thinner than others.
Something needs to 'eat' these ceilings for price to move up. The eater of liquidity is called a "market order". When someone submits a market order to the market it eats some liquidity and makes that floor/ceiling a little bit thinner. To trade a market you either need to provide liquidity (limit order) or consume liquidity (market order).
This is what causes price moves. You will often hear people say “price moves up when there are more buyers than sellers”. This is impossible. The markets are a mechanism for matching buyers and sellers. If there is no seller, you will not be buying anything. The markets move up because buy market orders consumed seller liquidity at a price level. The next buy market orders will eat the liquidity at a higher price. The numbers of contract brought = the number of contracts sold.
In the following image, you can see both the consumers and providers of liquidity on the order book. We can see existing Limit Orders and we can see the market orders that were filled against them

One of the most important things to understand about liquidity is that is that liquidity always and only exists at better prices than the current price. In other words, seller liquidity exists at higher prices than the current price. Buyer liquidity exists at lower prices than the current price.
This is common sense. If sellers wanted to sell below market price, then a trade would take place. Buyers would fall over themselves to buy at lower prices than market price because they would be able to turn an immediate profit.
Now, whilst liquidity only exists at better prices, ORDERS can exist at worse prices. This is not liquidity; for example a breakout trader might have a buy stop order to enter the market above the high. This is an order to enter at a worse price than current but this is going to consume liquidity, not provide it. This is not liquidity.
There is no seller liquidity below the current inside offer and there is no buyer liquidity above the current inside bid. In case this is not absolutely clear, here is a picture.

As you probably know, a lot of the limit orders we see on the DOM are fake. Some liquidity is real and some is not. This means that the numbers on the DOM won't always help us. There are some presumptions we can make about the real liquidity above and below that will help us to understand the market.
Some people are PAID to provide liquidity. These people are often called "Market Makers" and in many cases they are, although HFTs muddy the water somewhat. Anyone can be a liquidity provider and get paid to place limit orders. Most people don’t as you need deep pockets to play that game. The Market Makers get paid to place these limit orders. As price moves up and down, they are effectively capturing the spread between the inside bid and offer. They do not capture the spread at each price point; no-one can do that. What happens is that the market tends to move back where it came from and the spreads are captured over time. Market Makers have deep pockets. If a market is roaring up with no retraces, then the Market Maker is going to be short at higher and higher prices; as the price moves down, they'll unload that position, capturing their rebates and the spread as that occurs. These people aren't going to remain totally passive if things go too far against them. They can and do play games to ensure they make money. They will push the market around and shake people out whenever the opportunity arises.
These people are not a charity. They are doing it solely for their own benefit. They will stop providing liquidity when it is most needed, which is one of the things that feeds a market crash. As markets move down rapidly, liquidity providers end up with a large offside long position and they stop providing buy-side liquidity which fuels the move down. Crashes are not caused by selling; they are caused by lack of buy side liquidity. This applies to all markets; look at the US housing crash of 2008 onwards, there was a complete lack of buy side liquidity. It was not that case that everyone decided to sell their houses at the same time!
Other traders, for whatever reason, will put in limit orders at better prices than current. These may be algorithms or they may be actual people. On the sell side, people can put in limit orders to sell for higher prices. On the buy side people can put in limit orders to buy at lower prices. This is common sense, buyers want to buy low and sellers want to sell high. A trader might have put his limit order in a minute, an hour, a day or a week ago. Various people will have put in limit orders at various times putting in various amounts of thought into the process. If you are day trading, it doesn’t follow that everybody else is day trading. You might see 5000 Bid at a level and think it is somebody trying to turn the market around; this may be the case OR it may be that someone put this order for 5000 contracts in a week ago as a hedge and they aren’t really concerned at all what happens in the next 5 minutes.
One thing that is always true is that there are ZERO buy limit orders above the current price and there are ZERO sell limit orders below the current price.
This is important - so let’s put it up in bold:
"There are ZERO buy limit orders above the current price and there are ZERO sell limit orders below the current price".
Nature abhors a vacuum
If you want to understand why the market pulls back in an uptrend, keep "Nature abhors a vacuum" in mind.
- An uptrend starts.
- Price is at 1245
- There is ZERO buy side liquidity above 1245
- There IS buy side liquidity below 1245
- There IS sell side liquidity above 1245
- Market buy orders 'eat' the sell side liquidity and break through the ceiling
- Price moves up and up and up
- We are now at 1250
- There was no buy side liquidity above 1245 before
- There will be SOME buy side liquidity between 1245 and 1250 but it will be NEW liquidity that got placed there as price moved up.
- Some of this new buy side liquidity will be Market Makers who were SELLING as the market moved up
- Other people will have submitted new buy side liquidity on the way up
- Other people will still be THINKING about submitting buy side liquidity
The area between 1245->1250 now has (to an extent) a 'liquidity vacuum' on the buy side. The liquidity hasn't had chance to build up in that area as it has on the sell side. We are at 1250 - we have moved up into an area where sell side liquidity has been sitting for a while. We moved up into an area where no buy side liquidity existed before but where sell side liquidity exists. The ceiling is strong and the floor is very weak. Any uptrend will have a mix of market buyers and market sellers eating liquidity on both sides. We have market buyers and sellers, we have a strong ceiling and we have a weak floor.
- The market starts to move down as the weak floor is consumed on relatively little market selling
- Some new sellers may be thinking 'reversal' and jump on short
- As we move down, we move 'further back' in time OR to prices that have been traded a while back and where there has been more time to consider a buy side limit order
- We move down and the floor gets a little thicker
- At the same time, we move down into an area with ZERO sell side liquidity, the vacuum is now being created above us.
Eventually, we get to a point where we have a thicker floor below us and a relatively thin ceiling above. Price starts to move up and a whole bunch of traders (like me) think "Continuation". Anyone that sold the pullback starts to feel a little queasy and pukes out (by buying); we may see a little acceleration to the upside as the market becomes quite one-sided. Then the process starts over again.

The above picture shows price and cumulative delta. To understand cumulative delta, see the following article: http://www.trade2win.com/articles/1670-trading-cumulative-delta-indicator
We can see here a typical intra-day move. The top chart shows the price and the bottom chart shows the cumulative delta. Price moves down about 14 points with 2 major pullbacks. You can see that as the market is pulling back up, the cumulative delta hardly moves up at all (relative to the down move). We can safely say that this up move was caused by lack of sell side liquidity as a 'vacuum' was created there by the down move. It didn't take many buy market orders to move the price back up to where the liquidity was.
This is where we have the confidence to sell into a move up because we know that the move is caused by a temporary lack of sell side liquidity.
In Summary
The market is like a hi-rise building. It has floors (buy limit orders) and ceilings (sell limit orders).
It takes market orders to eat these floors & ceilings.
As you move up and go through a ceiling, it takes time to rebuild the floor behind you.
This lack of a floor, or 'liquidity vacuum' is the cause of pullbacks in trends.
This represents opportunity for you. Once you know that the market is 'vacuuming back', you suddenly aren't scared of fading that pullback.
Of course, other techniques such as Tape Reading will tell you where the pullback has ended.
Peter Davies can be contacted at Jigsaw Trading
Last edited by a moderator: