black bear
Guest
- Messages
- 1,303
- Likes
- 165
Hi mp, BANNED MEMBER
I've been using LRC and "s+r" overlays in the way you preached using diff TF and they have helped to improve my trading learning curve. Although i'm only using demo a/c, it does help my trading win ratio and in seeing the "bigger" picture of where price is heading so I must thank you for that.
Now according to your posts, when price hits either the top or bottom of LRC, we go flat
and see if price bounce or break before deciding on position so my question:
what do you look at/for next to "confirm" it is a bounce or a break before you safely enter a trade?
Dave
Hi Dave
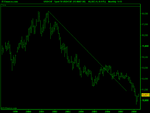
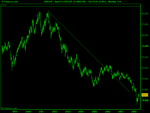
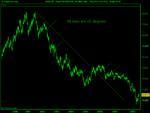
Not at all the best person to answer because not my method, just plucked a random pair from my old Sb account and marked some absolute 45 degree lines on a few various timeframes (Trend)
Hope some others join in and get T2W back on track with some real helpful posts etc for new traders
The problem is always how far out you go in search of the true trend :?:
I trade Ftse and look at month week day / 4hr 1 hr 15 min, that is a bit of overkill imho
3 timeframes is plenty
Long term trend and condition = trending or range bound = just eye balls should be enough
medium term trend = dito
Short term trend = dito = entry timeframe, many would take the breach of the previous Bars low in the short term trend as an indication that the higher timeframe trend is back in play, some would enter at a manual S&R drawn lines, Td uses a combination of Fibs manual S&R and price bar in the shape of a pinbar / Hammer at these levels. He manages risk in that timeframe and gives good advice on how to go about doing it in real time so the thread would imho be a good read for you Dave
http://www.trade2win.com/boards/first-steps/26947-making-money-trading.html
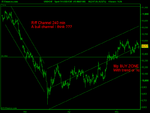
The last 240 min chart as raff channels on them, I prefer to mark my own with a manual line. Think Raff channels are auto adjusting and work on same principal as LRC lines ??
will stand corrected and could be way off
The point is they are not fixed in stone, the 240 min trend channel may run for a year or it could be over in the next minute following the NEWS 🙂
It could be the last time price is ever that high or ever that low
Is the 240 min chart / channel / trendline with the true trend ?, nothing is fixed in Stone
NOTHING
My own view regards trendlines and channels was given to me last Summer by Split
Trend lines, to me, are drawn arbitrarily. I just use them as a sort of "comfort line". If I am on the right side of it I feel fine and have no worries. The rule that they must be drawn across the tops or bottom is, more or less, telling the market what to do. How can you expect that of a price? When the price cuts the trend I look to see if a pattern is forming. If the pattern is continuous, I revert to a trend line, again, almost certainly, the momentum will have changed but if I keep to the right of it in a bear and to the left of it in a bull then I am OK- Whenever it crosses, it is a warning to pay attention to the trade, nothing more.
There is nothing to be learned from trend lines, IMO anyway, except to help keep the ship on course. Go inside it and you are entering into shallow water.
BY
Split
I was always told your best to wait and enter at the edge of what you think you see, (Range or channel) will not need to be wrong very long there will you :?:
See your entry before price gets there and plan the trade in advance no jumping in without looking
The first step for a trader is to determine the current trend of the market.
The second step is to determine one's place in the current trend.
The third step is to determine the proper timing of one's entry into whatever it is he's trading.
-- Richard Wyckoff
From my own rules ~
3.When putting on a trade, enter it as if it has the potential to be the
biggest trade of the year. Don't enter a trade until it has been well
thought out, a campaign has been devised for adding to the trade, and
contingency plans set for exiting the trade.
Hope some others join in and get T2W back on track with some real helpful posts etc for new traders
All the best with your trading and enjoy the search...............it should be Fun imho
Latter
Attachments
Last edited:


