QQQQ - review chart/trend lines

Peter1980

Newbie
Messages
8
Likes
0
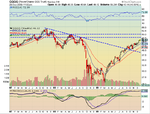
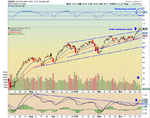
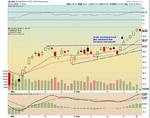
I've applied some trend lines to QQQQ as seen in the charts below and I'd like some advice. I'd like to learn more about the interrelationship between RSI/MACD/volume and price, as well as some kind of confirmation that I'm on track with the lines.

Any technical reasons whether or not this is a good position to get into for the short term (1 to 2 week)?
 

Attachments

  • QQQQ 1 - Dec29-09.png
    QQQQ 1 - Dec29-09.png
    76 KB · Views: 3,014
  • QQQQ 2 - Dec29-09.png
    QQQQ 2 - Dec29-09.png
    106.7 KB · Views: 7,006
  • QQQQ 3 - Dec29-09.png
    QQQQ 3 - Dec29-09.png
    78.6 KB · Views: 1,623
Last edited:
I'd be waiting for a fall to that new support line or possibly the trend line in your final chart. Then I'd go long. After binning the rest of the indicators. That's just me, though.
 
shadowninja: wouldn't the second chart indicate that the resistance line has been broken and that a trend is showing? Also, what other indicators would you use to help you decide? Thanks.
 
I've applied some trend lines to QQQQ as seen in the charts below and I'd like some advice. I'd like to learn more about the interrelationship between RSI/MACD/volume and price, as well as some kind of confirmation that I'm on track with the lines.

Any technical reasons whether or not this is a good position to get into for the short term (1 to 2 week)?

Price and volume are diverged, that why we have a bearish engulfing (red) candle at the end, and the RSI is at the oversold level and is bending downward, your third chart shows MACD line is turning down, Bollinger Bands are wider to indicate that the future moves would be more volatile. To go long is something I would not consider at all, if tomorrow there is additional bearish signs, I would try to short. If the market is so strong tomorrow and all of the signals are very bullish, I would rather stay out.

That's how my conclusion on reading of the chart.

QQQQDec28.png
 
shadowninja: wouldn't the second chart indicate that the resistance line has been broken and that a trend is showing? Also, what other indicators would you use to help you decide? Thanks.

Apologies. I meant the resistance line in chart 3. As for the trend "showing", it's been showing since the channel was "drawable". I'd have been looking for a good entry from September.

I use less indicators than you have! I just have anything between 1 and 4 trendlines (ie up to two channels) and a 200MA just for laughs. I suppose you could include major support and resistance price levels.

I used to have so many indicators that a Christmas tree would be jealous.
 
Price and volume are diverged, that why we have a bearish engulfing (red) candle at the end, and the RSI is at the oversold level and is bending downward, your third chart shows MACD line is turning down, Bollinger Bands are wider to indicate that the future moves would be more volatile. To go long is something I would not consider at all, if tomorrow there is additional bearish signs, I would try to short. If the market is so strong tomorrow and all of the signals are very bullish, I would rather stay out.

That's how my conclusion on reading of the chart.

QQQQDec28.png

songcon: Thanks for the input. I agree about the RSI and the diverging price/volume signaling an overbought trend. If you felt that tomorrow was a bearish signal, how long would you enter the market? Minutes/Hours/Days/Weeks?

By the way, this morning I placed a trailing stop of 0.10 and it was triggered 0.05 under my buy in price, for a total loss of $11 plus $10 commission. A $22 lesson.
 
Apologies. I meant the resistance line in chart 3. As for the trend "showing", it's been showing since the channel was "drawable". I'd have been looking for a good entry from September.

I use less indicators than you have! I just have anything between 1 and 4 trendlines (ie up to two channels) and a 200MA just for laughs. I suppose you could include major support and resistance price levels.

I used to have so many indicators that a Christmas tree would be jealous.

shadowninja: So would you consider getting in on the new trend line on chart 3 if the price bounces off it? How long of an uptrend would you wait for before entering long? And for how long would you enter? Days/hours/minutes?

You say you've been looking for a good entry since september. Was the beginning of November support test (for third time) not a good entry point with the RSI and MACD at lows? I would think that it would be a good entry, no? If not, why not?

Lastly, why did you give up on the indicators?
 
I would have already entered on the third touch of the trendline in Chart 3. That said, I would already have entered on the touch in November of the lower trendline and still be holding.

If I was to have to trade now, see my first post. Entry off support or the trendline depending on how long we wait (TL will cross support, obviously).

I got rid of them all because there was too much info and I just wasn't using it. If you can use it, use it.
 
QQQQ is an ETF ... Therefore it acts as an index TRACKER. Although it has its own supply and demand, this is limited by the ETF's tracking of the underlying.
When you think about this, it means that falling volume + rising price doesn't actually tell you anything ... Because the lower volume might just indicate that the ETF is currently unpopular to investors; It doesn't actually tell you that the market is rising on low volume. The volume might have huge similarities to the underlying; I don't know but that doesn't matter... The volume doesn't indicate anything as to a comparison with price.

Another thing to consider with the volume is that while in the underlying there has been lower volume, couldn't this be something to do with the time of year ?
Christmas, New years... Its holidays season - Therefore significantly less trades/volume is naturally occuring.

If you want to accurately analyse volume then check the underlying index.
 
GladiatorX: I see what you mean about QQQQ not necessarily representing the nasdaq 100 directly. However, take a look at this comparison of the nasdaq 100 to the QQQQ, which basically proves otherwise: http://www.google.com/finance?chdnp...to=NASDAQ:QQQQ&cmptdms=0&q=INDEXNASDAQ:.XNDX&

It pretty much follows along the nasdaq 100. Although I'm not sure about volume correlations.

Thats not what i meant at all. If you wish to trade Nasdaq, QQQQ is perfect. I was just commenting on your analysis of volume... Just think about it for a bit and you'll see what i mean.
Analysing the volume of the QQQQ's and saying ' Price went up on low volume ' is factually incorrect, the volume does not tell you this information.

I was only talking about Volume.

Ofcourse the PRICE is practically the same, its a tracker.

You analysed the volume of the QQQQ - and i was pointing out to you that the volume is only an indication of the popularility of the ETF, theoretically it may give a very clear view of actual underlying volume ... In principle however, thats just a guess/assumption - The fact is that if you want to analysis PRICE VS VOLUME then you need to do it in the underlying, because the volume in the Q's isn't actually what moves the price.

This means that, in terms of analysing volume - Look at the underlying (That doesn't mean trade the underlying...) and then use that analysis to make your trades...

Do you understand?
 
I've applied some trend lines to QQQQ as seen in the charts below and I'd like some advice. I'd like to learn more about the interrelationship between RSI/MACD/volume and price, as well as some kind of confirmation that I'm on track with the lines.

Any technical reasons whether or not this is a good position to get into for the short term (1 to 2 week)?

You might be interested in watching this guy. His QQQQ analysis is 2nd on the list, he's
made a few good calls
http://stockcharts.com/def/servlet/Favorites.CServlet?obj=ID703183
 
Top