SP500 UPDATE 26/05/2026
Technical Analysis — S&P 500 with Profit Line and Profit Advisor
Chart reading (H4 timeframe)
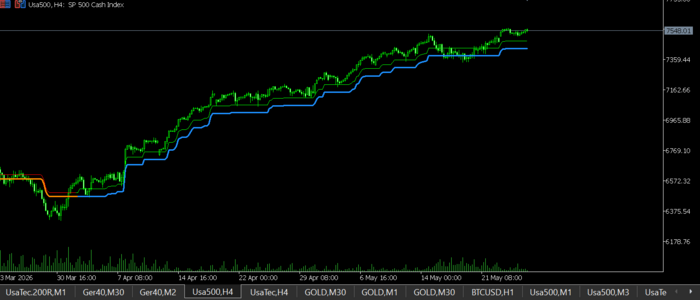
Price: 7,548.01 on the Cash Index, in all-time high territory.
Proprietary tools structure:
The current setup is exactly what you look for in any tradable uptrend:
- Profit Line (blue) — turned blue at the beginning of April and has never lost that color since. It's the structural support of the trend, the slower level that dictates the macro "mood" of the asset.
- Profit Advisor (green) — sitting above the Profit Line and below price. It's the tactical support, the short-term trigger.
- Price above both lines — full bullish alignment.
This is the classic setup these tools are designed to signal: both in uptrend mode and price respecting both. Before that, in late March, we saw the Profit Line in orange (downtrend mode) around 6,375 — the moment when the tool was signaling NOT to buy. The flip to blue in early April was the entry point of the current trend, and since then there has been no opposing signal.
What price action reveals
Looking at recent weeks:
- Every touch of the Profit Advisor was bought — on 05/14 and 05/21, price tagged the green line and reacted. This validates the line as active support, not just a visual reference.
- The Profit Line has never been tested since April — price has consistently held above the green line, which signals strength. In weaker trends, it's common to see price pierce the Advisor and test the Profit Line before resuming.
- Growing distance between price and Profit Line — sign of a mature trend. Not a problem, but it indicates that a technical pullback to the Advisor (or even to the Profit Line itself) is part of the natural cycle.
Operational levels
| Reference | Approx. value | Function |
|---|
| Current high | 7,548 | Resistance / all-time high |
| Profit Advisor (green) | ~7,420 | Tactical support — 1st test on a pullback |
| Profit Line (blue) | ~7,360 | Structural support — trend defense |
| Loss of Profit Line | <7,360 | Tone change — warning signal |
Integration with fundamentals
The fundamental scenario we described earlier is
fully aligned with what the Profit Line and Profit Advisor are signaling:
- Earnings revised upward, LTEG at all-time high, US economy with 3-4% GDP growth → the engine that keeps price above both lines.
- AI rally (Micron at $1 trillion, gains in Alphabet, Amazon, Nvidia) → the fuel for the short pullbacks that stop at the Profit Advisor.
- US-Iran de-escalation → removes the catalyst that could force a test of the Profit Line.
In other words: as long as the backdrop stays this way, it makes sense for the Profit Advisor to keep holding pullbacks. Only a relevant deterioration in fundamentals would justify a serious test of the Profit Line.
Scenarios for the coming days
Scenario 1 — Continuation (high probability): price stays above the Profit Advisor, with small pullbacks getting bought. Profit Line keeps slowly rising as a safety net. Trend-aligned trades remain valid.
Scenario 2 — Technical pullback (medium probability, especially with PCE on Thursday): price corrects down to the Profit Advisor (~7,420). If the green line holds, this is the setup these tools typically flag as an opportunity — a pullback within a confirmed trend. Stop below the Profit Line.
Scenario 3 — Profit Line test (low probability in the short term): a much hotter-than-expected PCE plus a return of geopolitical tension would trigger a deeper correction. Here the Profit Line (~7,360) would be the decisive level. Did it hold? Trend intact, opportunity. Did it break? Tone changes and you'd want to wait for a new signal from the tools.
Summary
The Profit Line and Profit Advisor have been
in full uptrend mode for nearly two months, and nothing in the current behavior suggests that signal is about to change in the coming sessions. The system is saying the same thing the fundamentals are: trend intact, buyers in control, pullbacks are opportunities as long as the green line holds.
The big immediate test is Thursday's PCE. But the beauty of these tools is precisely this — you don't need to guess the PCE outcome. You just need to watch how price reacts to the Profit Advisor after the print. If it holds, the thesis stands. If it breaks, the Profit Line will tell you whether it's just a pullback or a regime change.