Trend Following System S&P 500

miguelmadrid

Junior member
Messages
23
Likes
0
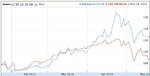
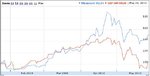
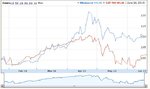
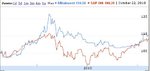
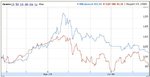
I am developing trend following System to invest on S&P 500 stocks.

The performance the last months is

15% my system 7% S&P 500

I used matlab code, and data base from bloomber...

Month performance:

Month Mitainvest S&P 500
February 2010 1.1 % 2.85 %
March 2010 6.45 % 5.88 %
April 2010 11.15 % 1.48 %
May 2010 -1.54 % -1.66 %


Mitainvest Current Portfolio

Date Shares Ticker Price Value Yield Weight
2010-05-10 1200 TLAB 8.97 10764 2.08 % 4.67 %
2010-05-07 1000 XRX 10.40 10400 3.9 % 4.51 %
2010-05-07 1700 HBAN 6.8701 11679 12.12 % 5.07 %
2010-05-07 2500 C 4.1175 10294 1.72 % 4.47 %
2010-05-07 1000 KEY 8.79 8790 11.33 % 3.81 %
2010-05-03 700 CBG 16.79 11753 -5.22 % 5.1 %
2010-05-03 1000 PHM 11.60 11600 -13.54 % 5.03 %
2010-05-03 1550 FTR 7.95 12323 -0.82 % 5.35 %
2010-05-03 1350 RF 8.865 11968 0.08 % 5.19 %
2010-05-03 2250 Q 5.35 12038 0.56 % 5.22 %
2010-05-03 950 EP 12.1502 11543 -0.93 % 5.01 %
2010-05-03 700 DHI 13.44 9408 -10.4 % 4.08 %
2010-05-03 1300 CPWR 8.17 10621 -3.85 % 4.61 %
2010-05-03 700 CMS 15.78 11046 -4.61 % 4.79 %
2010-04-11 2500 S 4.42 11050 9.19 % 4.79 %
2010-05-10 65254.1 Cash 1 65254.1 0 % 28.31%
Total Value: 230529.5 0.01 % 100%


I am interested in contact whith people who is developing Stock programs...

Thanks
 
doesnt look too good 4 u !

US:C 20100514 3.98 -0.11 -3% 8728000000 -2% Citigroup Inc
US:CBG 20100514 15.98 -0.67 -4% 3722000000 -10% CB Richard Ellis Group Inc
US:CMS 20100514 15.56 -0.12 -1% 4058000000 -6% CMS Energy Corp
US:CPWR 20100514 7.97 -0.23 -3% 4333000000 -6% Compuware Corp
US:DHI 20100514 13.11 -0.35 -3% 6926000000 -13% D.R. Horton Inc
US:EP 20100514 12.07 -0.09 -1% 1363000000 -2% El Paso Corp
US:FTR 20100514 7.84 -0.11 -1% 392000000 -2% Frontier Communications Ord Shs B
US:HBAN 20100514 6.53 -0.23 -3% 3307000000 7% Huntington Bancshares Inc
US:KEY 20100514 8.43 -0.25 -3% 2359000000 7% KeyCorp
US:pHM 20100514 11.59 -0.23 -2% 102000000 -14% Pultegroup Inc
US:Q 20100514 5.28 -0.09 -2% 3566000000 -1% Qwest Communications Internation
US:RF 20100514 8.26 -0.48 -5% 3425000000 -7% Regions Financial Corp
US:S 20100514 4.36 -0.1 -2% 6059000000 8% Sprint Nextel Corp
US:TLAB 20100514 8.61 -0.2 -2% 1037000000 -2% Tellabs Inc
US:XRX 20100514 10.02 -0.28 -3% 1459000000 0% XEROX CORP
 
doesnt look too good 4 u ! no follow up from your site. I hate this strange

behaviour of human beings
US:C Citigroup Inc 3.86 -0.00 -0.13% 385.2 Mil 12:11 PM ET
US:CBG CB Richard Ellis Group Inc 15.83 +0.01 +0.06% 1.825 Mil 12:11 PM ET
US:CMS CMS Energy Corp 15.64 +0.05 +0.32% 1.277 Mil 12:11 PM ET
US:CPWR Compuware Corp 7.72 -0.17 -2.15% 1.506 Mil 12:11 PM ET
US:DHI D.R. Horton Inc 13.36 +0.06 +0.45% 2.568 Mil 12:11 PM ET
US:EP El Paso Corp 11.73 +0.08 +0.70% 3.662 Mil 12:11 PM ET
US:FTR Frontier Communications Ord Sh 7.91 +0.05 +0.64% 1.902 Mil 12:11 PM ET
US:HBAN Huntington Bancshares Inc 6.33 -0.17 -2.62% 9.946 Mil 12:11 PM ET
US:KEY KeyCorp 8.03 -0.23 -2.78% 9.429 Mil 12:11 PM ET
US:pHM Pultegroup Inc 11.69 +0.04 +0.34% 3.326 Mil 12:11 PM ET
US:Q Qwest Communications InternatiInc 5.32 unch unch 13.98 Mil 12:11 PM ET
US:RF Regions Financial Corp 7.98 -0.29 -3.51% 8.864 Mil 12:11 PM ET
US:S Sprint Nextel Corp 4.68 +0.19 +4.28% 49.58 Mil 12:11 PM ET
US:TLAB Tellabs Inc 8.71 -0.03 -0.34% 4.49 Mil 12:11 PM ET
US:XRX XEROX CORP 10.17 +0.07 +0.69% 6.796 Mil
 
follow up

US:TLAB 201005180.0400 8.52 -0.22 -2.52% 1182000000 Tellabs Inc
US:XRX 201005180.0400 10.01 -0.09 -0.89% 1782000000 XEROX CORP
US:HBAN 201005180.0400 6.16 -0.34 -5.31% 3302000000 Huntington Bancshares Inc
US:C 201005180.0408 3.73 -0.13 -3.37% 8893000000 Citigroup Inc
US:KEY 201005180.0400 7.87 -0.39 -4.69% 2174000000 KeyCorp
US:CBG 201005180.0402 15.19 -0.63 -3.98% 5633000000 CB Richard Ellis Group Inc
US:pHM 201005180.0400 11.53 -0.12 -1.03% 8487000000 Pultegroup Inc
US:FTR 201005180.0400 7.86 unch unch 4385000000 Frontier Communications Ord Shs B
US:RF 201005180.0400 7.92 -0.35 -4.23% 2876000000 Regions Financial Corp
US:Q 201005180.0400 5.27 -0.05 -0.94% 3316000000 Qwest Communications International
US:EP 201005180.0400 11.52 -0.13 -1.12% 1225000000 El Paso Corp
US:DHI 201005180.0400 13.02 -0.28 -2.11% 7665000000 D.R. Horton Inc
US:CPWR 201005180.0400 7.66 -0.23 -2.92% 4745000000 Compuware Corp
US:CMS 201005180.0400 15.45 -0.14 -0.90% 311000000 CMS Energy Corp
US:S 201005180.0400 4.70 +0.21 +4.57% 1149000000 Sprint Nextel Corp
 
Mitainvest Current Portfolio
Date Shares Ticker Price Value Yield Weight
2010-05-17 1500 EK 5.825 8738 -0.62 % 3.88 %
2010-05-17 1800 THC 5.48 9864 -4.05 % 4.39 %
2010-05-17 700 SLE 14.895 10427 0.65 % 4.64 %
2010-05-17 1100 PCS 9.09 9999 2.62 % 4.45 %
2010-05-17 2000 NOVL 5.8942 11788 0.72 % 5.24 %
2010-05-17 700 DUK 17.06 11942 1.06 % 5.31 %
2010-05-10 1200 TLAB 8.61 10332 -2.02 % 4.59 %
2010-05-07 1700 HBAN 6.38 10846 4.13 % 4.82 %
2010-05-07 2500 C 3.8415 9604 -5.1 % 4.27 %
2010-05-07 1000 KEY 7.965 7965 0.88 % 3.54 %
2010-05-03 1550 FTR 7.90 12245 -1.45 % 5.44 %
2010-05-03 2250 Q 5.315 11959 -0.1 % 5.32 %
2010-04-11 2500 S 4.67 11675 15.36 % 5.19 %
2010-05-17 87548.9 Cash 1 87548.9 0 % 38.92%
Total Value: 224931.8 0.67 % 100%


Month Mitainvest S&P 500
February 2010 1.1 % 2.85 %
March 2010 6.45 % 5.88 %
April 2010 11.15 % 1.48 %
May 2010 -4.07 % -5.55 %


Thanks!!!!
 
Mitainvest Chart
 

Attachments

  • mitainvest.JPG
    mitainvest.JPG
    23.9 KB · Views: 454
u r just sitting waiting, arent u ? all your gains are lost!

20100517,1500,EK,5.825,8738,-0.0062,4%,5.61,EK,20-May,5.27,-6%
20100517,1800,THC,5.48,9864,-0.0405,4%,5.25,THC,20-May,5.18,-1%
20100517,700,SLE,14.895,10427,0.0065,5%,14.23,SLE,20-May,14.46,+2%
20100517,1100,PCS,9.09,9999,0.0262,4%,8.70,PCS,20-May,8.54,-2%
20100517,2000,NOVL,5.8942,11788,0.0072,5%,5.60,NOVL,20-May,5.91,+6%
20100517,700,DUK,17.06,11942,0.0106,5%,16.20,DUK,20-May,15.97,-1%
20100510,1200,TLAB,8.61,10332,-0.0202,5%,8.23,TLAB,20-May,8.34,+1%
20100507,1700,HBAN,6.38,10846,0.0413,5%,6.09,HBAN,20-May,5.85,-4%
20100507,2500,C,3.8415,9604,-0.051,4%,3.68,C,20-May,3.63,-1%
20100507,1000,KEY,7.965,7965,0.0088,4%,7.69,KEY,20-May,7.47,-3%
20100503,1550,FTR,7.9,12245,-0.0145,5%,7.49,FTR,20-May,7.73,+3%
20100503,2250,Q,5.315,11959,-0.001,5%,5.05,Q,20-May,5.01,-1%
20100411,2500,S,4.67,11675,0.1536,5%,4.44,S,20-May,4.32,-3%
 
How is Matlab to program? Difficult?

I run a trend system as well but have never seen particularly good results in backtesting for S&P. I think that's due to it being a composite of so many constituents, rather than a directly traded commodity per se.
 
Matlab is easy to learn, almost more easy than C++, Java....

It is perfecto to make automatic systems, it is powerful, and it can manage a lot of data...

It is a manual of matlab to bigenners...

http://faculty.olin.edu/bstorey/Notes/matlab.pdf


Are a lot of free material on internet, included to make trading systems in Matlab


Regards, Miguel...
 

Attachments

  • datos-mitainvest.JPG
    datos-mitainvest.JPG
    24.6 KB · Views: 593
Current performance Mitainvest fund:

Month Performance
Month Mitainvest S&P 500
February 2010 1.1 % 2.85 %
March 2010 6.45 % 5.88 %
April 2010 11.15 % 1.48 %
May 2010 -4.27 % -8.2 %
June 2010 -0.88 % 2.58 %

Year Performance
Year Mitainvest S&P 500
2010 11.18 % 2.36 %


Mitainvest Current Portfolio
Date Shares Ticker Price Value Yield Weight
2010-06-18 1350 IPG 8.32 11232 -0.91 % 5.05 %
2010-06-18 2000 S 4.59 9180 -1.28 % 4.13 %
2010-06-18 1500 MOT 7.26 10890 0.77 % 4.89 %
2010-06-18 1300 AMD 8.83 11479 -1.98 % 5.16 %
2010-06-14 1400 CPWR 8.67 12138 5.65 % 5.46 %
2010-06-14 2000 HBAN 6.05 12100 -0.53 % 5.44 %
2010-06-14 950 WIN 11.33 10764 0.96 % 4.84 %
2010-06-14 1300 KEY 8.37 10881 2.12 % 4.89 %
2010-06-14 850 EP 12.68 10778 4.03 % 4.84 %
2010-05-17 700 SLE 14.78 10346 -0.13 % 4.65 %
2010-05-17 1100 PCS 9.11 10021 2.85 % 4.5 %
2010-05-17 2000 NOVL 6.12 12240 4.59 % 5.5 %
2010-05-07 2500 C 4.01 10025 -0.94 % 4.51 %
2010-05-03 1550 FTR 7.83 12137 -2.32 % 5.46 %
2010-05-03 2250 Q 5.40 12150 1.49 % 5.46 %
2010-06-18 56120.1 Cash 1 56120.1 0 % 25.22%
Total Value: 222480.1 0.75 % 100%
 

Attachments

  • mitainvest.JPG
    mitainvest.JPG
    30.1 KB · Views: 482
Mitainvest Current Portfolio
Date Shares Ticker Price Value Yield Weight
2010-07-15 1800 Q 5.66 10188 2.52 % 4.94 %
2010-07-14 1100 PCS 8.90 9790 -5.91 % 4.74 %
2010-08-23 186353 Cash 1 186353 0 % 90.32%
Total Value: 206331 -0.16 % 100%


Month Mitainvest S&P 500
February 2010 1.1 % 2.85 %
March 2010 6.45 % 5.88 %
April 2010 11.15 % 1.48 %
May 2010 -4.27 % -8.2 %
June 2010 -5.04 % -5.39 %
July 2010 -1.58 % 6.88 %
August 2010 -1.65 % -5.1 %

Year Performance
Year Mitainvest S&P 500

2010 3.11 % -4.24 %
 
In my opinion the market is going to fall about 10% in the next months... I hope after october it will start to recover, until 1000 points of S&P500...

Thanks
 

Attachments

  • mitainvestt.JPG
    mitainvestt.JPG
    28.3 KB · Views: 315
Mitainvest Current Portfolio
Date Shares Ticker Price Value Yield Weight
2010-10-18 2750 ODP 4.6299 12732 -6.47 % 5.75 %
2010-10-18 3000 Q 6.45 19350 1.53 % 8.75 %
2010-10-18 1500 KEY 8.264 12396 -1.82 % 5.6 %
2010-10-18 1100 JNS 10.81 11891 -5.94 % 5.37 %
2010-10-18 2022 HBAN 5.67 11465 -1.09 % 5.18 %
2010-10-18 937 EP 13.15 12322 -1.4 % 5.57 %
2010-10-18 2800 C 4.11 11508 0.47 % 5.2 %
2010-10-18 2500 S 4.81 12025 5.85 % 5.44 %
2010-10-18 1600 RF 7.20 11520 -0.75 % 5.21 %
2010-10-18 1000 MAS 10.905 10905 0.31 % 4.93 %
2010-10-18 2675 LSI 4.68 12519 -0.14 % 5.66 %
2010-10-11 690 MBI 12.22 8432 14.52 % 3.81 %
2010-09-20 1100 AES 12.30 13530 7.87 % 6.12 %
2010-09-20 1000 XRX 11.41 11410 9.92 % 5.16 %
2010-09-20 2000 TLAB 7.78 15560 0.19 % 7.03 %
2010-09-16 1200 FTR 8.75 10500 10.82 % 4.75 %
2010-09-13 1300 MOT 7.87 10231 -3.03 % 4.62 %
2010-07-14 1100 PCS 10.57 11627 11.75 % 5.26 %
2010-10-18 1317 Cash 1 1317 0 % 0.6%
Total Value: 221239.3 2.07 % 100%


Month Performance
Month Mitainvest S&P 500
February 2010 1.1 % 2.85 %
March 2010 6.45 % 5.88 %
April 2010 11.15 % 1.48 %
May 2010 -4.27 % -8.2 %
June 2010 -5.04 % -5.39 %
July 2010 -1.58 % 6.88 %
August 2010 -1.59 % -3.36 %
September 2010 1.63 % 7.2 %
October 2010 5.46 % 3.51 %

Year Performance
Year Mitainvest S&P 500

2010 10.58 % 8.2 %
 
Chart performance


Mitainvest Current Portfolio
Date Shares Ticker Price Value Yield Weight
2010-10-18 2750 ODP 4.6299 12732 -6.47 % 5.75 %
2010-10-18 3000 Q 6.45 19350 1.53 % 8.75 %
2010-10-18 1500 KEY 8.264 12396 -1.82 % 5.6 %
2010-10-18 1100 JNS 10.81 11891 -5.94 % 5.37 %
2010-10-18 2022 HBAN 5.67 11465 -1.09 % 5.18 %
2010-10-18 937 EP 13.15 12322 -1.4 % 5.57 %
2010-10-18 2800 C 4.11 11508 0.47 % 5.2 %
2010-10-18 2500 S 4.81 12025 5.85 % 5.44 %
2010-10-18 1600 RF 7.20 11520 -0.75 % 5.21 %
2010-10-18 1000 MAS 10.905 10905 0.31 % 4.93 %
2010-10-18 2675 LSI 4.68 12519 -0.14 % 5.66 %
2010-10-11 690 MBI 12.22 8432 14.52 % 3.81 %
2010-09-20 1100 AES 12.30 13530 7.87 % 6.12 %
2010-09-20 1000 XRX 11.41 11410 9.92 % 5.16 %
2010-09-20 2000 TLAB 7.78 15560 0.19 % 7.03 %
2010-09-16 1200 FTR 8.75 10500 10.82 % 4.75 %
2010-09-13 1300 MOT 7.87 10231 -3.03 % 4.62 %
2010-07-14 1100 PCS 10.57 11627 11.75 % 5.26 %
2010-10-18 1317 Cash 1 1317 0 % 0.6%
Total Value: 221239.3 2.07 % 100%


Month Performance
Month Mitainvest S&P 500
February 2010 1.1 % 2.85 %
March 2010 6.45 % 5.88 %
April 2010 11.15 % 1.48 %
May 2010 -4.27 % -8.2 %
June 2010 -5.04 % -5.39 %
July 2010 -1.58 % 6.88 %
August 2010 -1.59 % -3.36 %
September 2010 1.63 % 7.2 %
October 2010 5.46 % 3.51 %

Year Performance
Year Mitainvest S&P 500

2010 10.58 % 8.2 %
 

Attachments

  • october.bmp
    345.2 KB · Views: 133
  • october.JPG
    october.JPG
    17.2 KB · Views: 125
Mitainvest Current Portfolio
Date Shares Ticker Price Value Yield Weight
2010-12-13 1492 IPG 10.86 16203 -2.36 % 7.42 %
2010-12-07 750 PCS 12.05 9038 -1.9 % 4.14 %
2010-12-07 80 FCX 113.21 9057 2.13 % 4.15 %
2010-12-07 100 RL 113.77 11377 1.51 % 5.21 %
2010-12-07 160 BTU 60.50 9680 -1.77 % 4.44 %
2010-12-07 150 TMK 60.30 9045 -1.47 % 4.14 %
2010-12-01 200 MWW 24.81 4962 7.79 % 2.27 %
2010-12-01 160 ANF 56.61 9058 12.01 % 4.15 %
2010-11-29 735 NYT 9.625 7074 6.61 % 3.24 %
2010-11-29 150 X 58.7399 8811 22.31 % 4.04 %
2010-11-29 10 PCLN 402.2599 4023 -0.72 % 1.84 %
2010-11-29 125 SNDK 48.87 6109 7.77 % 2.8 %
2010-11-28 170 APC 66.38 11285 4.23 % 5.17 %
2010-11-28 200 MEE 51.025 10205 2.79 % 4.68 %
2010-11-27 1224 MAS 13.03 15949 21.31 % 7.31 %
2010-11-27 1096 WIN 14.04 15388 6.64 % 7.05 %
2010-11-27 1185 DHI 11.21 13284 11.99 % 6.09 %
2010-11-26 933 NVDA 14.32 13361 3.87 % 6.12 %
2010-11-15 2000 LSI 5.98 11960 9.01 % 5.48 %
2010-10-18 3000 Q 7.46 22380 17.43 % 10.25 %
2010-12-13 7.6 Cash 1 7.6 0 % 0%
Total Value: 218253.9 7.39 % 100%


Month Mitainvest S&P 500
February 2010 1.1 % 2.85 %
March 2010 6.45 % 5.88 %
April 2010 11.15 % 1.48 %
May 2010 -4.27 % -8.2 %
June 2010 -5.04 % -5.39 %
July 2010 -1.58 % 6.88 %
August 2010 -1.59 % -3.36 %
September 2010 1.63 % 7.2 %
October 2010 3.33 % 3.69 %
November 2010 -5.17 % -0.23 %
December 2010 6.17 % 5.22 %

Year Performance
Year Mitainvest S&P 500

2010 9.09 % 13.78 %
 
If I dont include the commision the performance of mitainvest is 5% more than SP500

I had a programming mistake on november... The backtesting return is 25% annually included commisions.

Thanks.
 

Attachments

  • mitainvest.JPG
    mitainvest.JPG
    30.1 KB · Views: 149
Last edited by a moderator:
Top