Swing Trade. Emini S&P 500. Day to Day Trading.

malaspina

Active member
Messages
115
Likes
1
Swing Trade. Emini S&P 500, 12 days in the market.

This trade was made on Jan 21/2010 (Emini S&P 500). I only traded 1 contract since this was a pullback short play on a long term up trend. Shorting 1 contract at 1110.5, with a protective stop loss at a technical point. Soon after that the market continue the small down trend move, 12 days later I noticed a reversal candle with a clear macd/price divergence. This was enough reason for me to close my position (05/02/2010) at 1059.50 for a 50.50 points move during 12 days and a profit of US$ 1.003 after commissions. Look a chart below.

2010-02-21-swingtrade-eminisp500es.jpg


There are always micro down trends inside a clear up trend that a trader can profit if you know how to do it.

Stay tune for more.

Humberto Malaspina.:)
 
I am looking for an entry in the emini s&p 500 for a swing play, as soon as I get it I will post it here.

Humberto Malaspina.
 
There is something a little bit "wobbly" about your trade...50.50 points profit equates to $2525.00 less commissions...what am I missing?
 
You are right, my mistake posting the thread, I overlooked it. It is $2518 after commissions. Thank you.
 
From now on I will only post entry, stops and exits in real time with no charts of my swing trades only in my emini s&p 500 thread.

Humberto Malaspina.
 
I am still wating for an entry for my next swing trade in the emini S&P 500. As soon as I have it I will post it here with comments. In the meantime I want to share with you this article I wrote.

"The force behind the markets. "

It happens all time, day trading, swing trading, scalping, people looking at their screen during market hours, some do it at the close, some do it during night hours with every stock, futures contract, forex or whatever they can trade. Everybody is looking for the same thing; To make money. But many people lose money trading the markets. Why is it so difficult?. Well, I do not know the final answer, believe me, I do not know it, but the truth is only a few keep all the profits.

I wrote this article to share with the world the unique force behind the markets and that is A TREND. That is all. Look no further. Stop looking for the holy grail because there is none. Stop all the mambo jambo with the technical indicators, use as few as you can, I barely use one. Please keep your trading strategy as simple as possible, focus your attention in price action (trend spotting) and volume, done, end of the road. Look at this picture, 12 years ago when I started trading you could see me reading every book about trading, joined all the trading forums I could find, used all the technical indicators my screen could hold, spent hundreds of hours trying different and complicated trading strategies, the answer, I was just losing money until it dawn on me. After all this huge effort I made trying to understand the markets I can tell, it was worth it, I only had wished I had a mentor to spare me all the pain. The very simple truth is that the market is random with a trending component, you just need to find that trend and trade it using very simple rules of entry and exit with risk management depending on the amount of capital you have to trade. For god sake, it is that simple.

You just need to use the force of a trend in your favor to make money in the markets. Stop trying to catch top and bottoms, nobody can predict the future, just follow the trend and surf part of it. There will be always a new trend to play so stop trying to make a killing. Think in terms of cash flow and think of trading as a business; cash flow is for a business as blood for the human body.

Robert Kiyosaki says you only remember 10% or so of what you have read after one week of reading it. Well print out this article and keep it for you to remember the real force behind the markets.

Humberto Malaspina
 
This post is not exactly about day trading but as swing trading was mentioned in the headline I thought it'd be interesting to get some discussion going on how S&P is moving.

1280837666_img-d41d8cd98f00b204e9800998ecf8427e.png


S&P 500

Index has been creating higher highs which suggested that the 200 day SMA would be broken. Last Friday's high volume buying around the GDP release supported this view. Now we've seen how S&P, for the first time since it's move below the 200 day SMA on 20th May, has been able to show strength and leave the moving average behind.

Fibonacci extension points to 1145,75 being the first target but then I'd expect it to move closer to the resistance at 1200. I wouldn't be surprised if the 200 SMA would be tested before the market bounces higher.

I'd appreciate your views on S&P or if a more relevant thread exists please point me towards it.

Cheers!
 
Hi Malaspina
How's your daytrading of the S&P500?
We've had a very frustrating day today:
http://deltafutures.wordpress.com/

Let me know if we can share strategies.

Louie

Excellent blog Louie. Keeping track of everyday trades is a great way to sharpen neurons and synapses inside the brain which are responsible for our learning and memory.

However, after reading the trades, i felt you are cutting your winners short by huge amount. The trades which can give you 25 + points, you are booking them for 1-4 points. I know most traders face this problem including myself, so lets see if we can gind out a solution to that.
 
Hi guys
A great day today:
Two great calls during the premarket session:

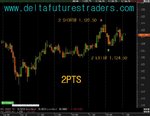
1st: 8.00am GMT0 -> SHORT 1.093.00 EXIT 1.090.00 3pts profit

2nd: 12:00pm GMT0 -> SHORT 1.096.00 EXIT 1.092.00 4pts profit

7pts before the opening of the market!

trade-es-20100908pre1.gif


We’ve waited then for the session to open. The market was trying to break 1.093 since the close of the session of the previous day, a very important support.

The market opened rising very quickly and because the momentum was right we took a trade at the open:

LONG 1.095.25 EXIT 1.097.25 2pts profit.

We were having a great trading day: 3 great calls.

So we patiently waited for a turning point in the market: SHORT 1.101.50

WHY? 2 very strong reasons: The XXXXXX and the YYYYYYY pointed to that entry level.

The market rose to 1.101.25 and we missed the trade by 1 tick.

Still confident on the entry level we waited for the price. And it came.

We could’ve taken 2 easy pts in 10min but we wanted to do a “Position Trade”. Risky? Hell yeah but we at a great backup: 9pts in the bag!

We waited and waited and finally after almost 3hours we closed the position: 5pts profit. WE WERE RIGHT!

The market returned to its original support: 1.093.00

Because of this fact we strongly expect an uprise tomorrow.

trade-es-20100908.gif
 
Hi Malaspina, very nice article and awesome trading! I have been in the markets for many years and have seen news traders use so many indicators that it is a struggle to see price. When I first began I had many indicators as well, so I was part of the group at one time. I now focus on day trading the es and go with the less is more approach.
 
Hi Malaspina, very nice article and awesome trading! I have been in the markets for many years and have seen news traders use so many indicators that it is a struggle to see price. When I first began I had many indicators as well, so I was part of the group at one time. I now focus on day trading the es and go with the less is more approach.

Yes Matt, indeed I just posted about it in my blog, take a look at:

Humberto Malaspina Blog
 
Just took a peak at your blog. Looks good. I like that you have trading is a never ending cycle. When I got out of high school I knew I wanted a career where I would always be able to learn and grow in, and I didn't want to do anything that I would eventually grow stagnate in. Trading has definitely given me that and more.
 
Top