Dentalfloss
Legendary member
- Messages
- 63,404
- Likes
- 3,726
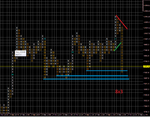
xauusd into the death zone...again


scenario played out..a new downtrend2035 res nailed...marked before fed...could have gone anywhere..though
we either pump or dump
supp/minor at 2031 to 2032 area
horizontal supp at 2027 area
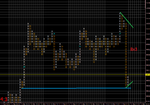
we either get a bullish move
a fake
or a new downtrend