Dentalfloss
Legendary member
- Messages
- 63,404
- Likes
- 3,726
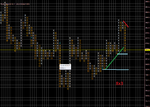
no guarantees...could be a fake..lolspx broken that minor downtrend that started on eTuesday evening
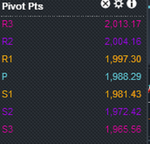
1987-1988 big confluence area for a bull test
1986 horizontal supp
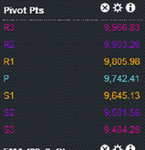
we could go to 9900..maybe 10k and even 10065 .. and 2007-2010 on spx
lets see if the bulls can take charge