Dentalfloss
Legendary member
- Messages
- 63,404
- Likes
- 3,726
scalps in and out
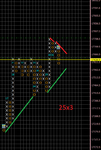
needs to pump that 9830scalp from 9800 supp
scalps in and out9850 as we marked
excellent run
nailed
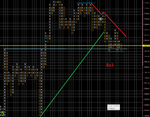
dax updated

Just covered my 17765 short before nfp. Lets see whats next.